29
/
en
AIzaSyAYiBZKx7MnpbEhh9jyipgxe19OcubqV5w
April 1, 2024
284264
Yemen, Rep.
YEM
true
2
1
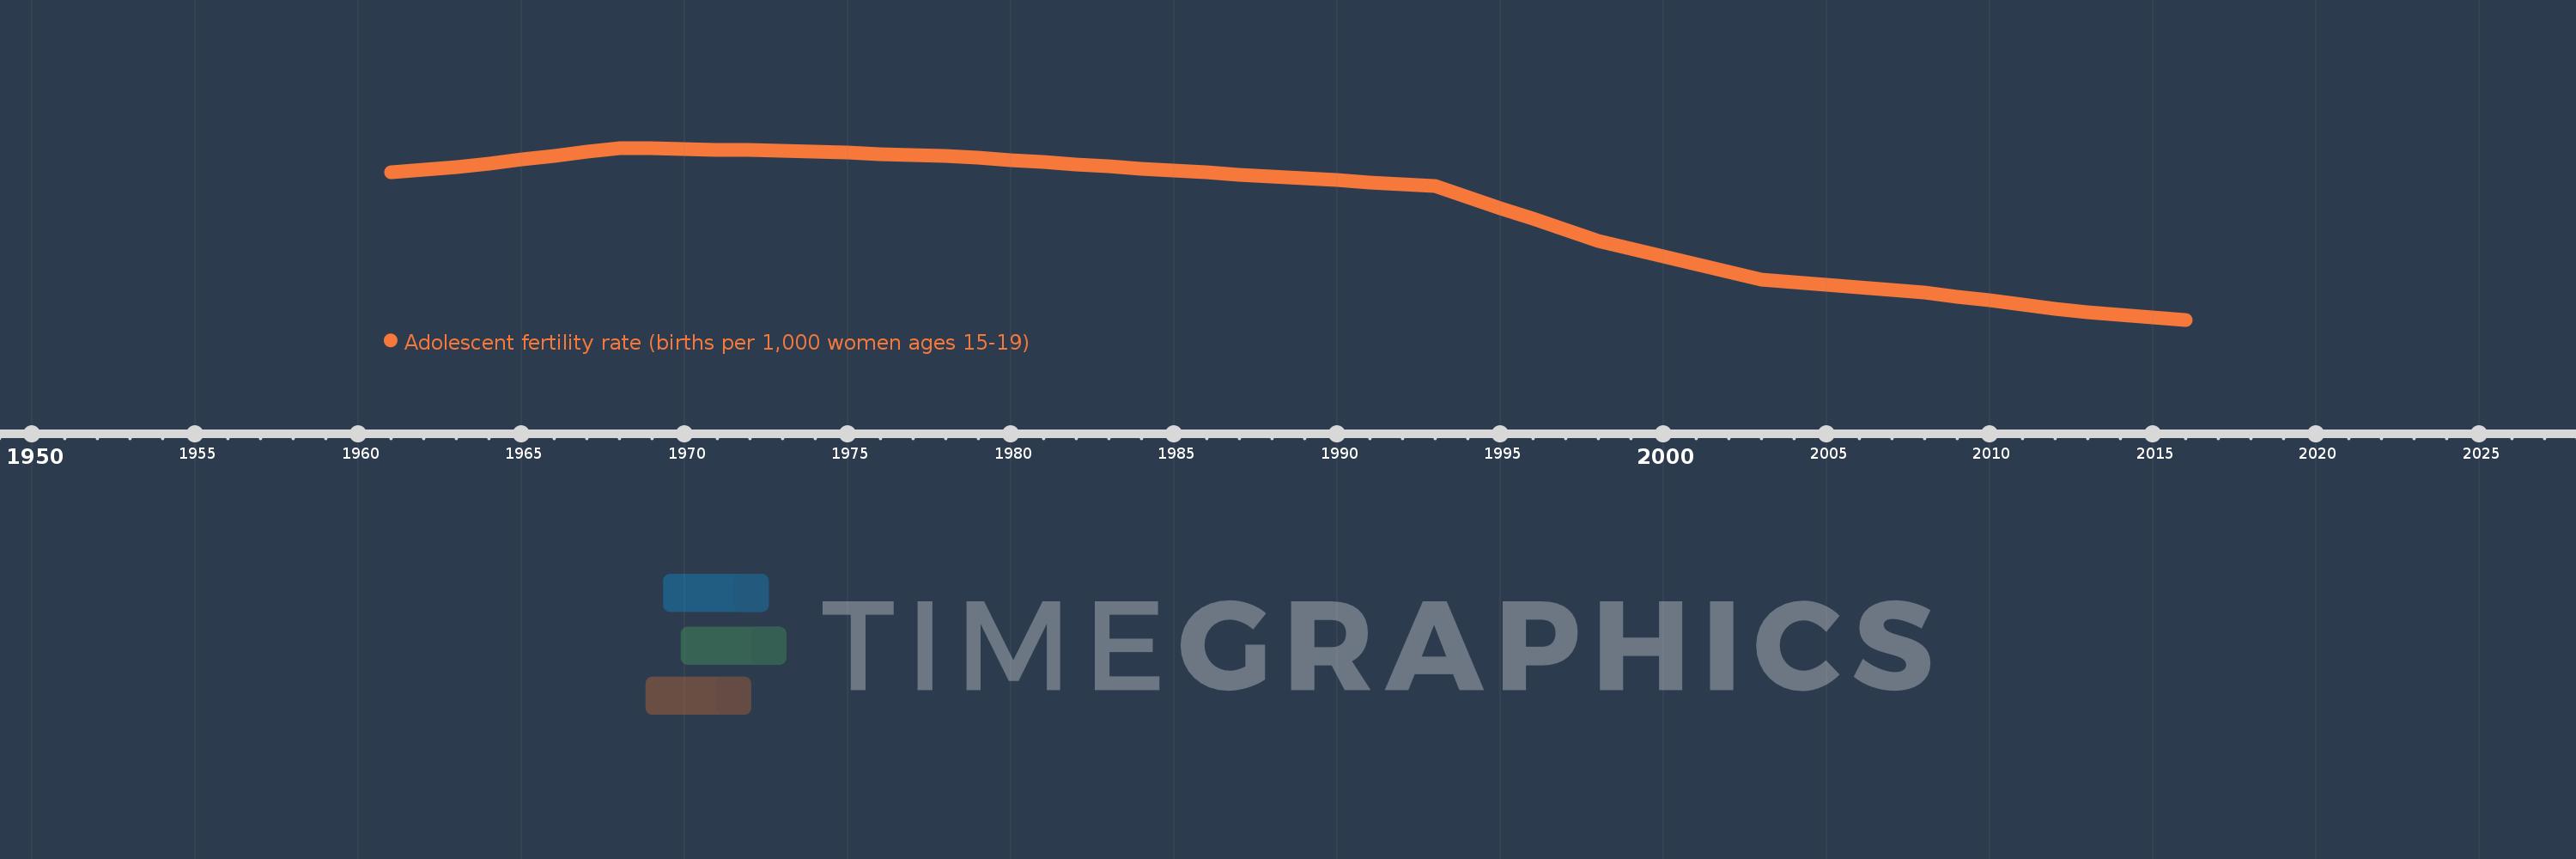
Adolescent fertility rate (births per 1,000 women ages 15-19)
2016,2015,2014,2013,2012,2011,2010,2009,2008,2007,2006,2005,2004,2003,2002,2001,2000,1999,1998,1997,1996,1995,1994,1993,1992,1991,1990,1989,1988,1987,1986,1985,1984,1983,1982,1981,1980,1979,1978,1977,1976,1975,1974,1973,1972,1971,1970,1969,1968,1967,1966,1965,1964,1963,1962,1961
This statistics in other country:
AfghanistanAlbaniaAlgeriaAngolaAntigua and BarbudaArab WorldArgentinaArmeniaArubaAustraliaAustriaAzerbaijanBahamas, TheBahrainBangladeshBarbadosBelarusBelgiumBelizeBeninBhutanBoliviaBosnia and HerzegovinaBotswanaBrazilBrunei DarussalamBulgariaBurkina FasoBurundiCabo VerdeCambodiaCameroonCanadaCaribbean small statesCentral African RepublicCentral Europe and the BalticsChadChannel IslandsChileChinaColombiaComorosCongo, Dem. Rep.Congo, Rep.Costa RicaCote d'IvoireCroatiaCubaCuracaoCyprusCzech RepublicDenmarkDjiboutiDominican RepublicEarly-demographic dividendEast Asia & PacificEast Asia & Pacific (excluding high income)East Asia & Pacific (IDA & IBRD countries)EcuadorEgypt, Arab Rep.El SalvadorEquatorial GuineaEritreaEstoniaEthiopiaEuro areaEurope & Central AsiaEurope & Central Asia (excluding high income)Europe & Central Asia (IDA & IBRD countries)European UnionFijiFinlandFragile and conflict affected situationsFranceFrench PolynesiaGabonGambia, TheGeorgiaGermanyGhanaGreeceGrenadaGuamGuatemalaGuineaGuinea-BissauGuyanaHaitiHeavily indebted poor countries (HIPC)High incomeHondurasHong Kong SAR, ChinaHungaryIBRD onlyIcelandIDA & IBRD totalIDA blendIDA onlyIDA totalIndiaIndonesiaIran, Islamic Rep.IraqIrelandIsraelItalyJamaicaJapanJordanKazakhstanKenyaKiribatiKorea, Dem. People’s Rep.Korea, Rep.KuwaitKyrgyz RepublicLao PDRLate-demographic dividendLatin America & Caribbean Latin America & Caribbean (excluding high income)Latin America & the Caribbean (IDA & IBRD countries)LatviaLeast developed countries: UN classificationLebanonLesothoLiberiaLibyaLithuaniaLow & middle incomeLow incomeLower middle incomeLuxembourgMacao SAR, ChinaMacedonia, FYRMadagascarMalawiMalaysiaMaldivesMaliMaltaMauritaniaMauritiusMexicoMicronesia, Fed. Sts.Middle East & North AfricaMiddle East & North Africa (excluding high income)Middle East & North Africa (IDA & IBRD countries)Middle incomeMoldovaMongoliaMontenegroMoroccoMozambiqueMyanmarNamibiaNepalNetherlandsNew CaledoniaNew ZealandNicaraguaNigerNigeriaNorth AmericaNorwayOECD membersOmanOther small statesPacific island small statesPakistanPanamaPapua New GuineaParaguayPeruPhilippinesPolandPortugalPost-demographic dividendPre-demographic dividendPuerto RicoQatarRomaniaRussian FederationRwandaSamoaSao Tome and PrincipeSaudi ArabiaSenegalSerbiaSeychellesSierra LeoneSingaporeSlovak RepublicSloveniaSmall statesSolomon IslandsSomaliaSouth AfricaSouth AsiaSouth Asia (IDA & IBRD)South SudanSpainSri LankaSt. LuciaSt. Vincent and the GrenadinesSub-Saharan Africa Sub-Saharan Africa (excluding high income)Sub-Saharan Africa (IDA & IBRD countries)SudanSurinameSwazilandSwedenSwitzerlandSyrian Arab RepublicTajikistanTanzaniaThailandTimor-LesteTogoTongaTrinidad and TobagoTunisiaTurkeyTurkmenistanUgandaUkraineUnited Arab EmiratesUnited KingdomUnited StatesUpper middle incomeUruguayUzbekistanVanuatuVenezuela, RBVietnamVirgin Islands (U.S.)West Bank and GazaWorldYemen, Rep.ZambiaZimbabwe Timeline:
This timeline shows a graph from 1961 to 2016 of Yemen, Rep.. No data until 1960. Number of actual observations by date: 56.
Source name:
World Development Indicators
Source organization:
United Nations Population Division, World Population Prospects.
Categories, topics:
Health, Gender, Social Development
Last updated:
apr 23, 2017
Indicators value changes by year
Minimum:
60.695
jan 1, 2016
Maximum:
170.771
jan 1, 1968
At the date of observation
Value
Absolute change
Change from previous value
jan 1, 1961
155.214
+155.214
0.0%
jan 1, 1962
156.845
+1.631
1.05%
jan 1, 1963
158.476
+1.631
1.04%
jan 1, 1964
160.935
+2.459
1.55%
jan 1, 1965
163.394
+2.459
1.53%
jan 1, 1966
165.853
+2.459
1.5%
jan 1, 1967
168.312
+2.459
1.48%
jan 1, 1968
170.771
+2.459
1.46%
jan 1, 1969
170.407
-0.364
-0.21%
jan 1, 1970
170.042
-0.364
-0.21%
jan 1, 1971
169.678
-0.364
-0.21%
jan 1, 1972
169.313
-0.364
-0.21%
jan 1, 1973
168.949
-0.364
-0.22%
jan 1, 1974
168.299
-0.65
-0.38%
jan 1, 1975
167.649
-0.65
-0.39%
jan 1, 1976
166.999
-0.65
-0.39%
jan 1, 1977
166.349
-0.65
-0.39%
jan 1, 1978
165.699
-0.65
-0.39%
jan 1, 1979
164.331
-1.368
-0.83%
jan 1, 1980
162.963
-1.368
-0.83%
jan 1, 1981
161.594
-1.368
-0.84%
jan 1, 1982
160.226
-1.368
-0.85%
jan 1, 1983
158.858
-1.368
-0.85%
jan 1, 1984
157.58
-1.278
-0.8%
jan 1, 1985
156.302
-1.278
-0.81%
jan 1, 1986
155.023
-1.278
-0.82%
jan 1, 1987
153.745
-1.278
-0.82%
jan 1, 1988
152.467
-1.278
-0.83%
jan 1, 1989
151.222
-1.245
-0.82%
jan 1, 1990
149.976
-1.245
-0.82%
jan 1, 1991
148.731
-1.245
-0.83%
jan 1, 1992
147.485
-1.245
-0.84%
jan 1, 1993
146.24
-1.245
-0.84%
jan 1, 1994
139.255
-6.985
-4.78%
jan 1, 1995
132.27
-6.985
-5.02%
jan 1, 1996
125.285
-6.985
-5.28%
jan 1, 1997
118.3
-6.985
-5.58%
jan 1, 1998
111.315
-6.985
-5.9%
jan 1, 1999
106.307
-5.008
-4.5%
jan 1, 2000
101.299
-5.008
-4.71%
jan 1, 2001
96.291
-5.008
-4.94%
jan 1, 2002
91.283
-5.008
-5.2%
jan 1, 2003
86.275
-5.008
-5.49%
jan 1, 2004
84.646
-1.629
-1.89%
jan 1, 2005
83.018
-1.629
-1.92%
jan 1, 2006
81.389
-1.629
-1.96%
jan 1, 2007
79.761
-1.629
-2.0%
jan 1, 2008
78.132
-1.629
-2.04%
jan 1, 2009
75.556
-2.576
-3.3%
jan 1, 2010
72.979
-2.576
-3.41%
jan 1, 2011
70.403
-2.576
-3.53%
jan 1, 2012
67.826
-2.576
-3.66%
jan 1, 2013
65.25
-2.576
-3.8%
jan 1, 2014
63.732
-1.518
-2.33%
jan 1, 2015
62.214
-1.518
-2.38%
jan 1, 2016
60.695
-1.518
-2.44%
Ranking of countries by current statistics by years


Comments: