29
/
en
AIzaSyAYiBZKx7MnpbEhh9jyipgxe19OcubqV5w
April 1, 2024
62354
World
WLD
false
2
1
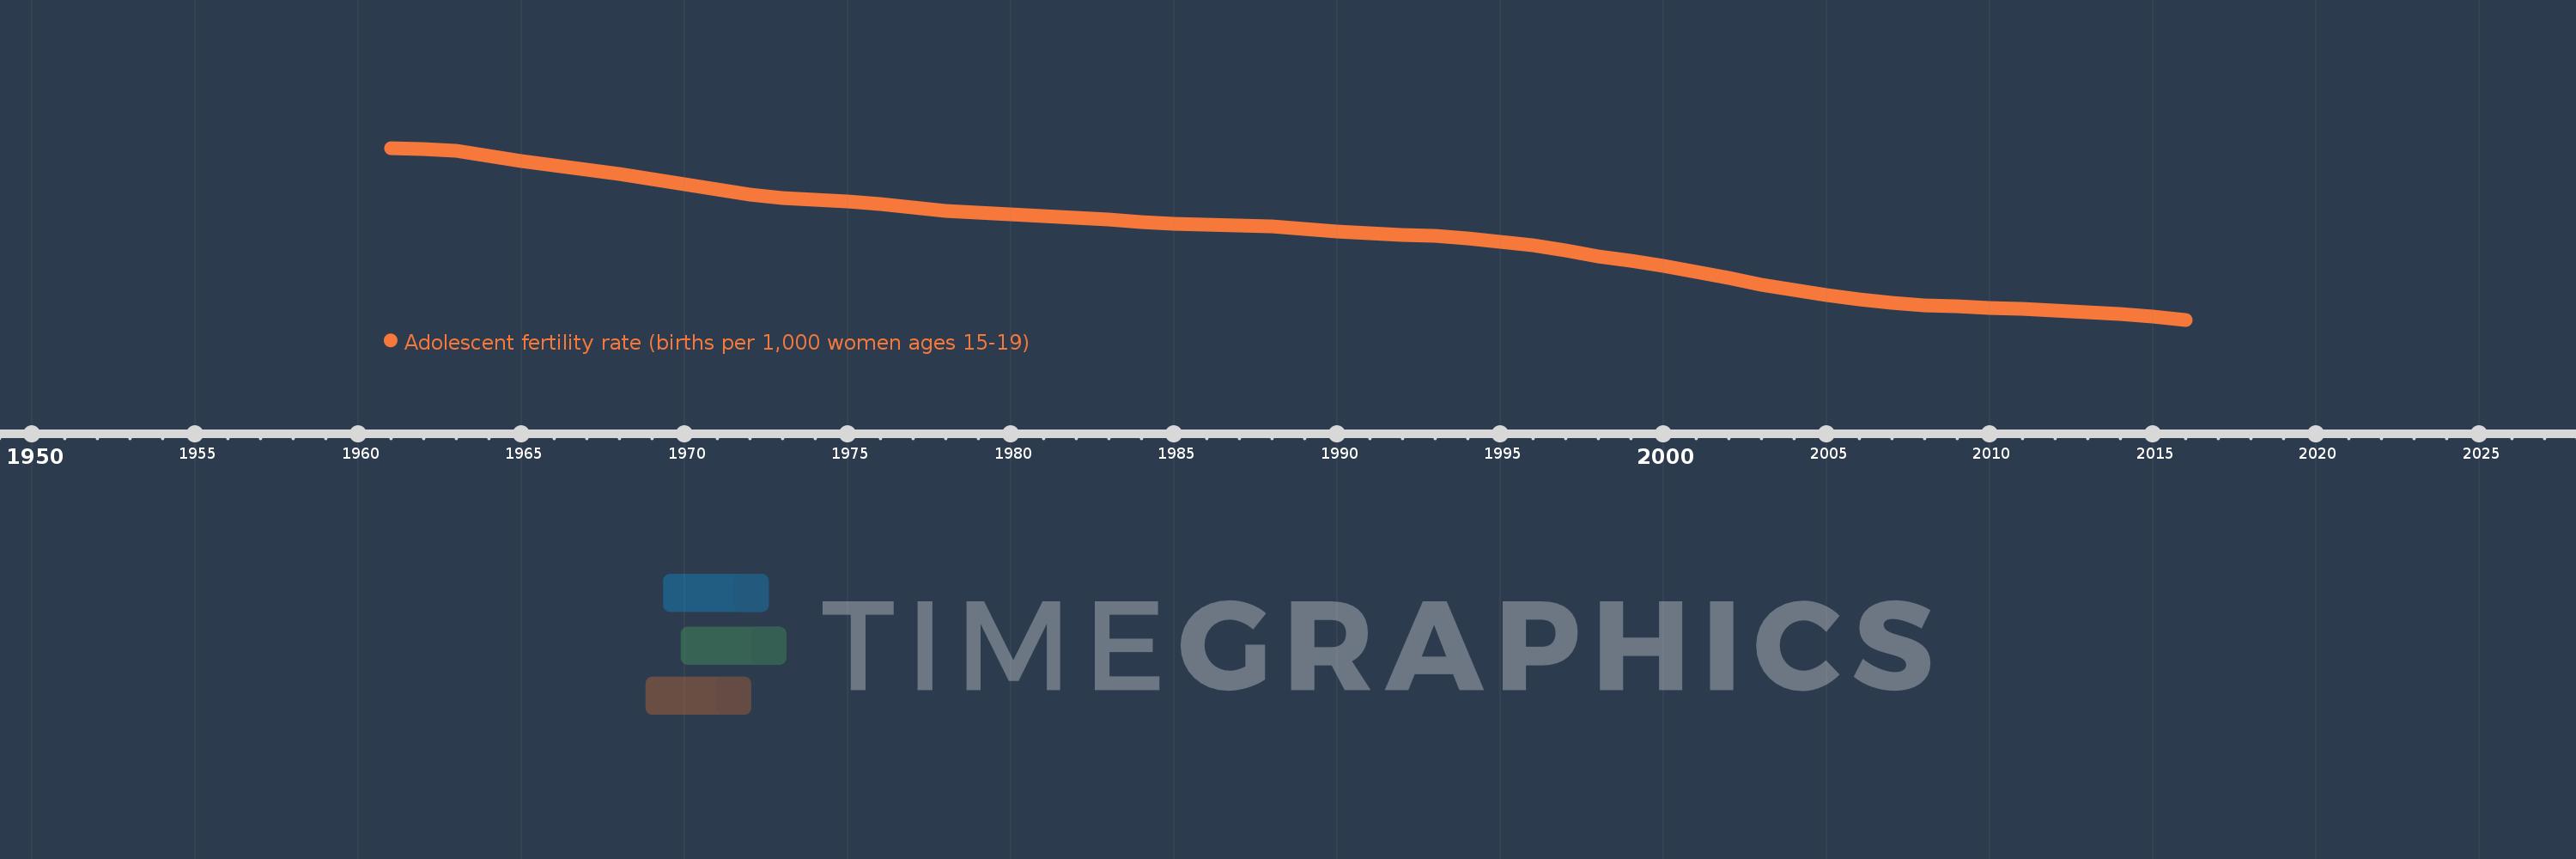
Adolescent fertility rate (births per 1,000 women ages 15-19)
2016,2015,2014,2013,2012,2011,2010,2009,2008,2007,2006,2005,2004,2003,2002,2001,2000,1999,1998,1997,1996,1995,1994,1993,1992,1991,1990,1989,1988,1987,1986,1985,1984,1983,1982,1981,1980,1979,1978,1977,1976,1975,1974,1973,1972,1971,1970,1969,1968,1967,1966,1965,1964,1963,1962,1961
This statistics in other country:
AfghanistanAlbaniaAlgeriaAngolaAntigua and BarbudaArab WorldArgentinaArmeniaArubaAustraliaAustriaAzerbaijanBahamas, TheBahrainBangladeshBarbadosBelarusBelgiumBelizeBeninBhutanBoliviaBosnia and HerzegovinaBotswanaBrazilBrunei DarussalamBulgariaBurkina FasoBurundiCabo VerdeCambodiaCameroonCanadaCaribbean small statesCentral African RepublicCentral Europe and the BalticsChadChannel IslandsChileChinaColombiaComorosCongo, Dem. Rep.Congo, Rep.Costa RicaCote d'IvoireCroatiaCubaCuracaoCyprusCzech RepublicDenmarkDjiboutiDominican RepublicEarly-demographic dividendEast Asia & PacificEast Asia & Pacific (excluding high income)East Asia & Pacific (IDA & IBRD countries)EcuadorEgypt, Arab Rep.El SalvadorEquatorial GuineaEritreaEstoniaEthiopiaEuro areaEurope & Central AsiaEurope & Central Asia (excluding high income)Europe & Central Asia (IDA & IBRD countries)European UnionFijiFinlandFragile and conflict affected situationsFranceFrench PolynesiaGabonGambia, TheGeorgiaGermanyGhanaGreeceGrenadaGuamGuatemalaGuineaGuinea-BissauGuyanaHaitiHeavily indebted poor countries (HIPC)High incomeHondurasHong Kong SAR, ChinaHungaryIBRD onlyIcelandIDA & IBRD totalIDA blendIDA onlyIDA totalIndiaIndonesiaIran, Islamic Rep.IraqIrelandIsraelItalyJamaicaJapanJordanKazakhstanKenyaKiribatiKorea, Dem. People’s Rep.Korea, Rep.KuwaitKyrgyz RepublicLao PDRLate-demographic dividendLatin America & Caribbean Latin America & Caribbean (excluding high income)Latin America & the Caribbean (IDA & IBRD countries)LatviaLeast developed countries: UN classificationLebanonLesothoLiberiaLibyaLithuaniaLow & middle incomeLow incomeLower middle incomeLuxembourgMacao SAR, ChinaMacedonia, FYRMadagascarMalawiMalaysiaMaldivesMaliMaltaMauritaniaMauritiusMexicoMicronesia, Fed. Sts.Middle East & North AfricaMiddle East & North Africa (excluding high income)Middle East & North Africa (IDA & IBRD countries)Middle incomeMoldovaMongoliaMontenegroMoroccoMozambiqueMyanmarNamibiaNepalNetherlandsNew CaledoniaNew ZealandNicaraguaNigerNigeriaNorth AmericaNorwayOECD membersOmanOther small statesPacific island small statesPakistanPanamaPapua New GuineaParaguayPeruPhilippinesPolandPortugalPost-demographic dividendPre-demographic dividendPuerto RicoQatarRomaniaRussian FederationRwandaSamoaSao Tome and PrincipeSaudi ArabiaSenegalSerbiaSeychellesSierra LeoneSingaporeSlovak RepublicSloveniaSmall statesSolomon IslandsSomaliaSouth AfricaSouth AsiaSouth Asia (IDA & IBRD)South SudanSpainSri LankaSt. LuciaSt. Vincent and the GrenadinesSub-Saharan Africa Sub-Saharan Africa (excluding high income)Sub-Saharan Africa (IDA & IBRD countries)SudanSurinameSwazilandSwedenSwitzerlandSyrian Arab RepublicTajikistanTanzaniaThailandTimor-LesteTogoTongaTrinidad and TobagoTunisiaTurkeyTurkmenistanUgandaUkraineUnited Arab EmiratesUnited KingdomUnited StatesUpper middle incomeUruguayUzbekistanVanuatuVenezuela, RBVietnamVirgin Islands (U.S.)West Bank and GazaWorldYemen, Rep.ZambiaZimbabwe Timeline:
This timeline shows a graph from 1961 to 2016 of World. No data until 1960. Number of actual observations by date: 56.
Source name:
World Development Indicators
Source organization:
United Nations Population Division, World Population Prospects.
Categories, topics:
Health, Gender, Social Development
Last updated:
apr 23, 2017
Indicators value changes by year
Minimum:
44.033
jan 1, 2016
Maximum:
86.521
jan 1, 1961
At the date of observation
Value
Absolute change
Change from previous value
jan 1, 1961
86.521
+86.521
0.0%
jan 1, 1962
86.336
-0.185
-0.21%
jan 1, 1963
85.827
-0.509
-0.59%
jan 1, 1964
84.493
-1.334
-1.55%
jan 1, 1965
83.218
-1.275
-1.51%
jan 1, 1966
82.114
-1.104
-1.33%
jan 1, 1967
81.088
-1.025
-1.25%
jan 1, 1968
80.189
-0.899
-1.11%
jan 1, 1969
78.831
-1.358
-1.69%
jan 1, 1970
77.501
-1.331
-1.69%
jan 1, 1971
76.287
-1.214
-1.57%
jan 1, 1972
75.074
-1.213
-1.59%
jan 1, 1973
74.084
-0.99
-1.32%
jan 1, 1974
73.641
-0.443
-0.6%
jan 1, 1975
73.186
-0.455
-0.62%
jan 1, 1976
72.619
-0.568
-0.78%
jan 1, 1977
71.882
-0.736
-1.01%
jan 1, 1978
70.993
-0.89
-1.24%
jan 1, 1979
70.623
-0.369
-0.52%
jan 1, 1980
70.193
-0.43
-0.61%
jan 1, 1981
69.77
-0.423
-0.6%
jan 1, 1982
69.241
-0.529
-0.76%
jan 1, 1983
68.729
-0.511
-0.74%
jan 1, 1984
68.162
-0.567
-0.83%
jan 1, 1985
67.736
-0.426
-0.63%
jan 1, 1986
67.453
-0.283
-0.42%
jan 1, 1987
67.245
-0.208
-0.31%
jan 1, 1988
67.142
-0.103
-0.15%
jan 1, 1989
66.444
-0.698
-1.04%
jan 1, 1990
65.871
-0.573
-0.86%
jan 1, 1991
65.43
-0.441
-0.67%
jan 1, 1992
65.074
-0.355
-0.54%
jan 1, 1993
64.836
-0.238
-0.37%
jan 1, 1994
64.162
-0.675
-1.04%
jan 1, 1995
63.375
-0.787
-1.23%
jan 1, 1996
62.38
-0.995
-1.57%
jan 1, 1997
61.125
-1.255
-2.01%
jan 1, 1998
59.705
-1.42
-2.32%
jan 1, 1999
58.614
-1.091
-1.83%
jan 1, 2000
57.358
-1.256
-2.14%
jan 1, 2001
55.967
-1.391
-2.42%
jan 1, 2002
54.418
-1.549
-2.77%
jan 1, 2003
52.764
-1.654
-3.04%
jan 1, 2004
51.335
-1.429
-2.71%
jan 1, 2005
50.077
-1.258
-2.45%
jan 1, 2006
49.069
-1.008
-2.01%
jan 1, 2007
48.26
-0.809
-1.65%
jan 1, 2008
47.664
-0.596
-1.23%
jan 1, 2009
47.322
-0.342
-0.72%
jan 1, 2010
47.029
-0.293
-0.62%
jan 1, 2011
46.709
-0.32
-0.68%
jan 1, 2012
46.34
-0.369
-0.79%
jan 1, 2013
45.959
-0.381
-0.82%
jan 1, 2014
45.398
-0.561
-1.22%
jan 1, 2015
44.767
-0.63
-1.39%
jan 1, 2016
44.033
-0.735
-1.64%
Ranking of countries by current statistics by years


Comments: