29
/
en
AIzaSyAYiBZKx7MnpbEhh9jyipgxe19OcubqV5w
April 1, 2024
139957
Ghana
GHA
true
2
1
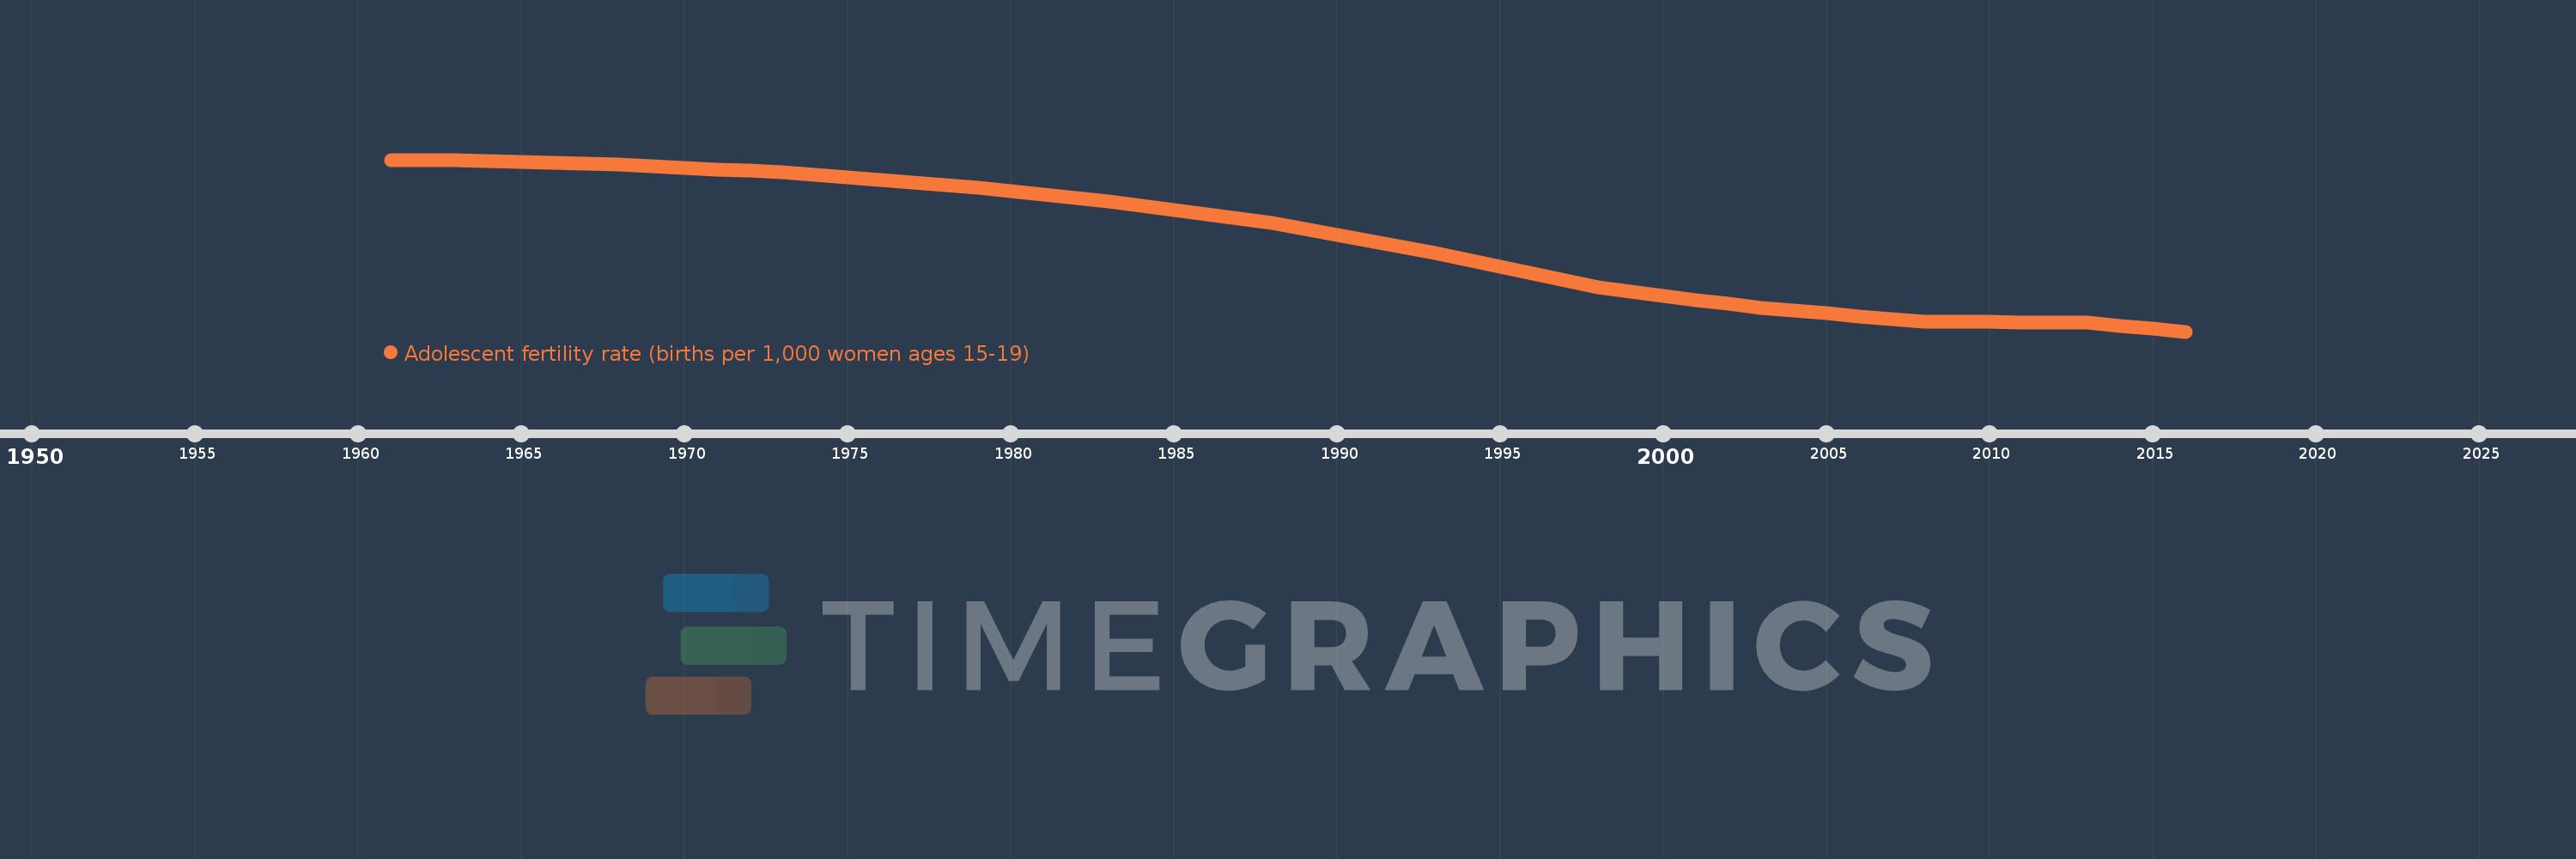
Adolescent fertility rate (births per 1,000 women ages 15-19)
2016,2015,2014,2013,2012,2011,2010,2009,2008,2007,2006,2005,2004,2003,2002,2001,2000,1999,1998,1997,1996,1995,1994,1993,1992,1991,1990,1989,1988,1987,1986,1985,1984,1983,1982,1981,1980,1979,1978,1977,1976,1975,1974,1973,1972,1971,1970,1969,1968,1967,1966,1965,1964,1963,1962,1961
This statistics in other country:
AfghanistanAlbaniaAlgeriaAngolaAntigua and BarbudaArab WorldArgentinaArmeniaArubaAustraliaAustriaAzerbaijanBahamas, TheBahrainBangladeshBarbadosBelarusBelgiumBelizeBeninBhutanBoliviaBosnia and HerzegovinaBotswanaBrazilBrunei DarussalamBulgariaBurkina FasoBurundiCabo VerdeCambodiaCameroonCanadaCaribbean small statesCentral African RepublicCentral Europe and the BalticsChadChannel IslandsChileChinaColombiaComorosCongo, Dem. Rep.Congo, Rep.Costa RicaCote d'IvoireCroatiaCubaCuracaoCyprusCzech RepublicDenmarkDjiboutiDominican RepublicEarly-demographic dividendEast Asia & PacificEast Asia & Pacific (excluding high income)East Asia & Pacific (IDA & IBRD countries)EcuadorEgypt, Arab Rep.El SalvadorEquatorial GuineaEritreaEstoniaEthiopiaEuro areaEurope & Central AsiaEurope & Central Asia (excluding high income)Europe & Central Asia (IDA & IBRD countries)European UnionFijiFinlandFragile and conflict affected situationsFranceFrench PolynesiaGabonGambia, TheGeorgiaGermanyGhanaGreeceGrenadaGuamGuatemalaGuineaGuinea-BissauGuyanaHaitiHeavily indebted poor countries (HIPC)High incomeHondurasHong Kong SAR, ChinaHungaryIBRD onlyIcelandIDA & IBRD totalIDA blendIDA onlyIDA totalIndiaIndonesiaIran, Islamic Rep.IraqIrelandIsraelItalyJamaicaJapanJordanKazakhstanKenyaKiribatiKorea, Dem. People’s Rep.Korea, Rep.KuwaitKyrgyz RepublicLao PDRLate-demographic dividendLatin America & Caribbean Latin America & Caribbean (excluding high income)Latin America & the Caribbean (IDA & IBRD countries)LatviaLeast developed countries: UN classificationLebanonLesothoLiberiaLibyaLithuaniaLow & middle incomeLow incomeLower middle incomeLuxembourgMacao SAR, ChinaMacedonia, FYRMadagascarMalawiMalaysiaMaldivesMaliMaltaMauritaniaMauritiusMexicoMicronesia, Fed. Sts.Middle East & North AfricaMiddle East & North Africa (excluding high income)Middle East & North Africa (IDA & IBRD countries)Middle incomeMoldovaMongoliaMontenegroMoroccoMozambiqueMyanmarNamibiaNepalNetherlandsNew CaledoniaNew ZealandNicaraguaNigerNigeriaNorth AmericaNorwayOECD membersOmanOther small statesPacific island small statesPakistanPanamaPapua New GuineaParaguayPeruPhilippinesPolandPortugalPost-demographic dividendPre-demographic dividendPuerto RicoQatarRomaniaRussian FederationRwandaSamoaSao Tome and PrincipeSaudi ArabiaSenegalSerbiaSeychellesSierra LeoneSingaporeSlovak RepublicSloveniaSmall statesSolomon IslandsSomaliaSouth AfricaSouth AsiaSouth Asia (IDA & IBRD)South SudanSpainSri LankaSt. LuciaSt. Vincent and the GrenadinesSub-Saharan Africa Sub-Saharan Africa (excluding high income)Sub-Saharan Africa (IDA & IBRD countries)SudanSurinameSwazilandSwedenSwitzerlandSyrian Arab RepublicTajikistanTanzaniaThailandTimor-LesteTogoTongaTrinidad and TobagoTunisiaTurkeyTurkmenistanUgandaUkraineUnited Arab EmiratesUnited KingdomUnited StatesUpper middle incomeUruguayUzbekistanVanuatuVenezuela, RBVietnamVirgin Islands (U.S.)West Bank and GazaWorldYemen, Rep.ZambiaZimbabwe Timeline:
This timeline shows a graph from 1961 to 2016 of Ghana. No data until 1960. Number of actual observations by date: 56.
Source name:
World Development Indicators
Source organization:
United Nations Population Division, World Population Prospects.
Categories, topics:
Health, Gender, Social Development
Last updated:
apr 23, 2017
Indicators value changes by year
Minimum:
66.126
jan 1, 2016
Maximum:
148.345
jan 1, 1961
At the date of observation
Value
Absolute change
Change from previous value
jan 1, 1961
148.345
+148.345
0.0%
jan 1, 1962
148.234
-0.11
-0.07%
jan 1, 1963
148.124
-0.11
-0.07%
jan 1, 1964
147.69
-0.434
-0.29%
jan 1, 1965
147.255
-0.434
-0.29%
jan 1, 1966
146.821
-0.434
-0.29%
jan 1, 1967
146.386
-0.434
-0.3%
jan 1, 1968
145.952
-0.434
-0.3%
jan 1, 1969
145.231
-0.721
-0.49%
jan 1, 1970
144.51
-0.721
-0.5%
jan 1, 1971
143.79
-0.721
-0.5%
jan 1, 1972
143.069
-0.721
-0.5%
jan 1, 1973
142.348
-0.721
-0.5%
jan 1, 1974
141.162
-1.186
-0.83%
jan 1, 1975
139.975
-1.186
-0.84%
jan 1, 1976
138.789
-1.186
-0.85%
jan 1, 1977
137.602
-1.186
-0.85%
jan 1, 1978
136.416
-1.186
-0.86%
jan 1, 1979
134.797
-1.619
-1.19%
jan 1, 1980
133.179
-1.619
-1.2%
jan 1, 1981
131.56
-1.619
-1.22%
jan 1, 1982
129.942
-1.619
-1.23%
jan 1, 1983
128.323
-1.619
-1.25%
jan 1, 1984
126.263
-2.06
-1.61%
jan 1, 1985
124.203
-2.06
-1.63%
jan 1, 1986
122.143
-2.06
-1.66%
jan 1, 1987
120.083
-2.06
-1.69%
jan 1, 1988
118.023
-2.06
-1.72%
jan 1, 1989
115.195
-2.828
-2.4%
jan 1, 1990
112.367
-2.828
-2.46%
jan 1, 1991
109.538
-2.828
-2.52%
jan 1, 1992
106.71
-2.828
-2.58%
jan 1, 1993
103.882
-2.828
-2.65%
jan 1, 1994
100.532
-3.35
-3.23%
jan 1, 1995
97.181
-3.35
-3.33%
jan 1, 1996
93.831
-3.35
-3.45%
jan 1, 1997
90.48
-3.35
-3.57%
jan 1, 1998
87.13
-3.35
-3.7%
jan 1, 1999
85.175
-1.955
-2.24%
jan 1, 2000
83.221
-1.955
-2.29%
jan 1, 2001
81.266
-1.955
-2.35%
jan 1, 2002
79.312
-1.955
-2.41%
jan 1, 2003
77.357
-1.955
-2.46%
jan 1, 2004
76.08
-1.277
-1.65%
jan 1, 2005
74.802
-1.277
-1.68%
jan 1, 2006
73.525
-1.277
-1.71%
jan 1, 2007
72.247
-1.277
-1.74%
jan 1, 2008
70.97
-1.277
-1.77%
jan 1, 2009
70.826
-0.144
-0.2%
jan 1, 2010
70.682
-0.144
-0.2%
jan 1, 2011
70.538
-0.144
-0.2%
jan 1, 2012
70.394
-0.144
-0.2%
jan 1, 2013
70.25
-0.144
-0.2%
jan 1, 2014
68.875
-1.375
-1.96%
jan 1, 2015
67.5
-1.375
-2.0%
jan 1, 2016
66.126
-1.375
-2.04%
Ranking of countries by current statistics by years


Comments: