29
/
en
AIzaSyAYiBZKx7MnpbEhh9jyipgxe19OcubqV5w
April 1, 2024
152212
Hungary
HUN
true
2
1
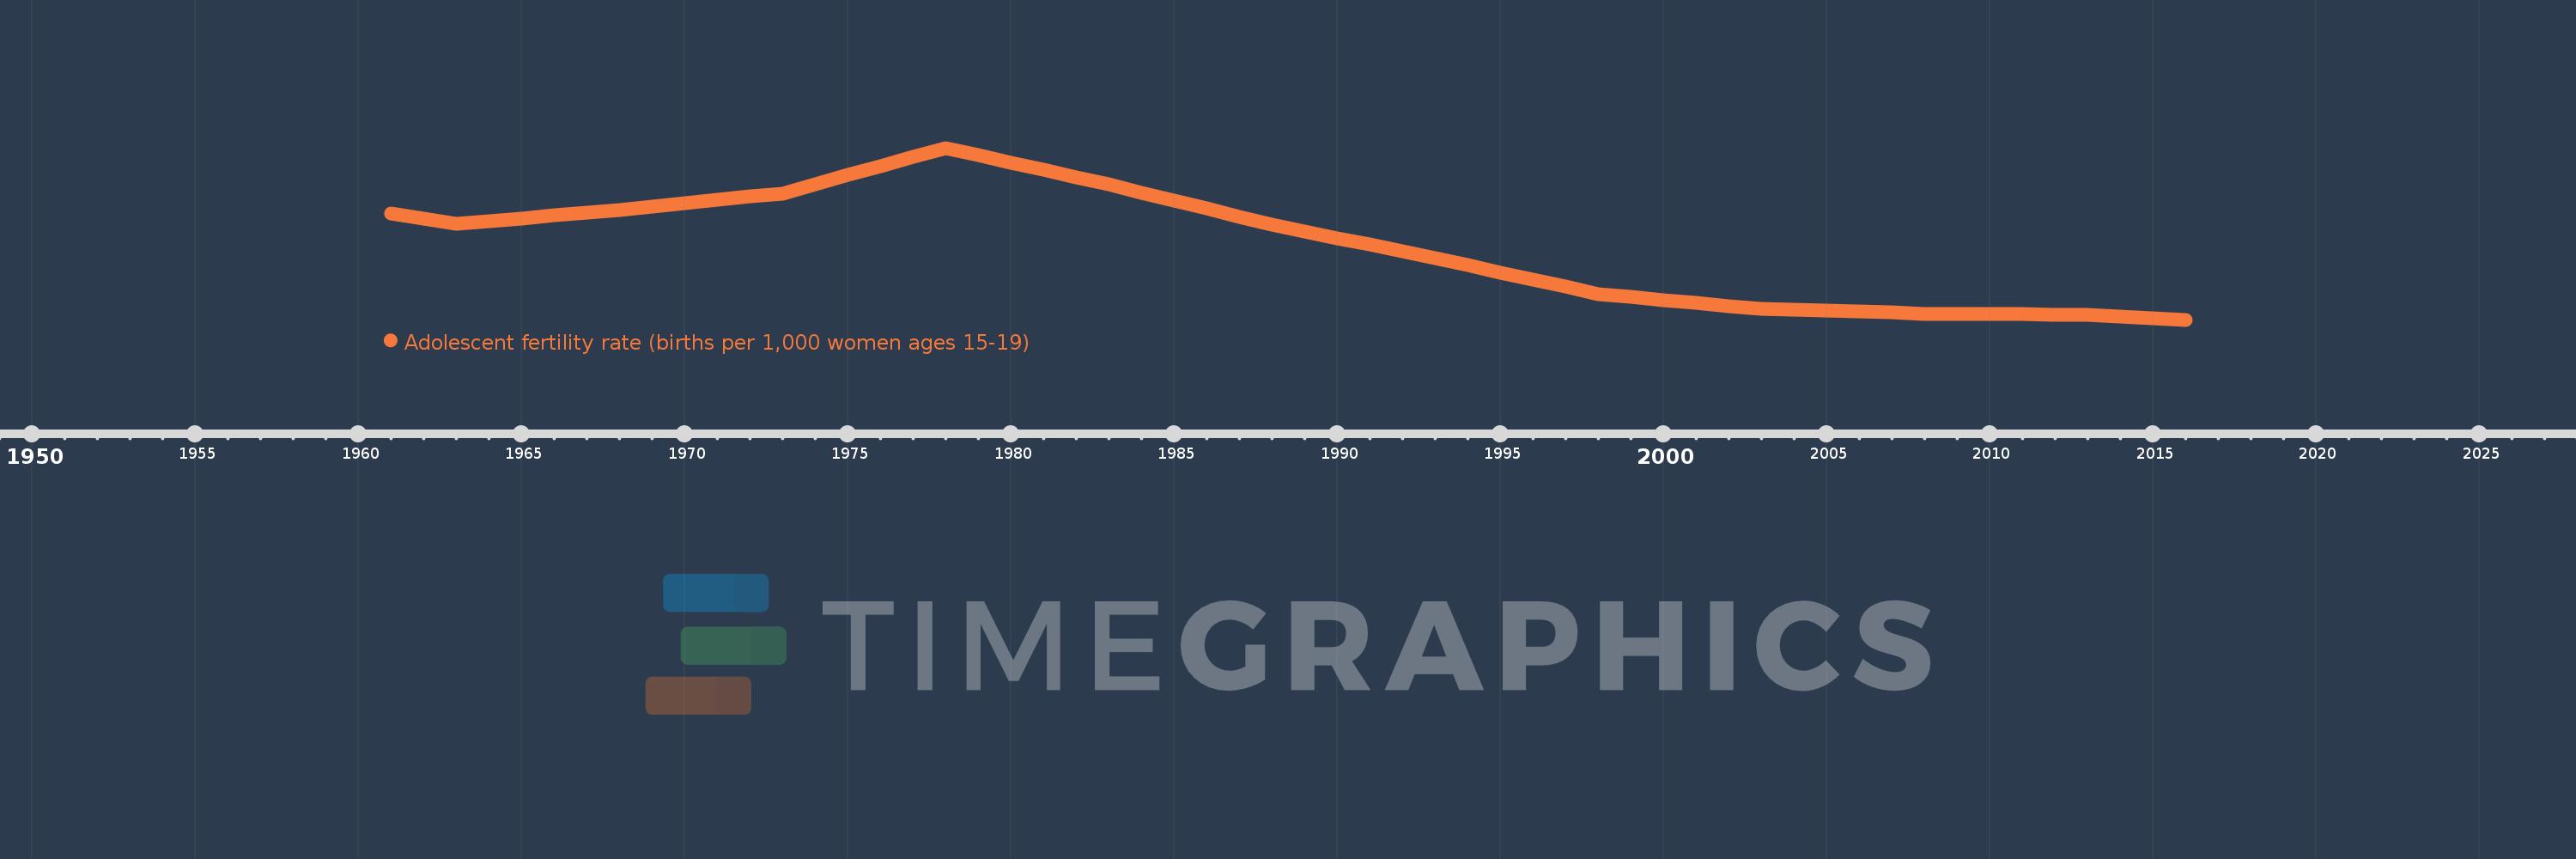
Adolescent fertility rate (births per 1,000 women ages 15-19)
2016,2015,2014,2013,2012,2011,2010,2009,2008,2007,2006,2005,2004,2003,2002,2001,2000,1999,1998,1997,1996,1995,1994,1993,1992,1991,1990,1989,1988,1987,1986,1985,1984,1983,1982,1981,1980,1979,1978,1977,1976,1975,1974,1973,1972,1971,1970,1969,1968,1967,1966,1965,1964,1963,1962,1961
This statistics in other country:
AfghanistanAlbaniaAlgeriaAngolaAntigua and BarbudaArab WorldArgentinaArmeniaArubaAustraliaAustriaAzerbaijanBahamas, TheBahrainBangladeshBarbadosBelarusBelgiumBelizeBeninBhutanBoliviaBosnia and HerzegovinaBotswanaBrazilBrunei DarussalamBulgariaBurkina FasoBurundiCabo VerdeCambodiaCameroonCanadaCaribbean small statesCentral African RepublicCentral Europe and the BalticsChadChannel IslandsChileChinaColombiaComorosCongo, Dem. Rep.Congo, Rep.Costa RicaCote d'IvoireCroatiaCubaCuracaoCyprusCzech RepublicDenmarkDjiboutiDominican RepublicEarly-demographic dividendEast Asia & PacificEast Asia & Pacific (excluding high income)East Asia & Pacific (IDA & IBRD countries)EcuadorEgypt, Arab Rep.El SalvadorEquatorial GuineaEritreaEstoniaEthiopiaEuro areaEurope & Central AsiaEurope & Central Asia (excluding high income)Europe & Central Asia (IDA & IBRD countries)European UnionFijiFinlandFragile and conflict affected situationsFranceFrench PolynesiaGabonGambia, TheGeorgiaGermanyGhanaGreeceGrenadaGuamGuatemalaGuineaGuinea-BissauGuyanaHaitiHeavily indebted poor countries (HIPC)High incomeHondurasHong Kong SAR, ChinaHungaryIBRD onlyIcelandIDA & IBRD totalIDA blendIDA onlyIDA totalIndiaIndonesiaIran, Islamic Rep.IraqIrelandIsraelItalyJamaicaJapanJordanKazakhstanKenyaKiribatiKorea, Dem. People’s Rep.Korea, Rep.KuwaitKyrgyz RepublicLao PDRLate-demographic dividendLatin America & Caribbean Latin America & Caribbean (excluding high income)Latin America & the Caribbean (IDA & IBRD countries)LatviaLeast developed countries: UN classificationLebanonLesothoLiberiaLibyaLithuaniaLow & middle incomeLow incomeLower middle incomeLuxembourgMacao SAR, ChinaMacedonia, FYRMadagascarMalawiMalaysiaMaldivesMaliMaltaMauritaniaMauritiusMexicoMicronesia, Fed. Sts.Middle East & North AfricaMiddle East & North Africa (excluding high income)Middle East & North Africa (IDA & IBRD countries)Middle incomeMoldovaMongoliaMontenegroMoroccoMozambiqueMyanmarNamibiaNepalNetherlandsNew CaledoniaNew ZealandNicaraguaNigerNigeriaNorth AmericaNorwayOECD membersOmanOther small statesPacific island small statesPakistanPanamaPapua New GuineaParaguayPeruPhilippinesPolandPortugalPost-demographic dividendPre-demographic dividendPuerto RicoQatarRomaniaRussian FederationRwandaSamoaSao Tome and PrincipeSaudi ArabiaSenegalSerbiaSeychellesSierra LeoneSingaporeSlovak RepublicSloveniaSmall statesSolomon IslandsSomaliaSouth AfricaSouth AsiaSouth Asia (IDA & IBRD)South SudanSpainSri LankaSt. LuciaSt. Vincent and the GrenadinesSub-Saharan Africa Sub-Saharan Africa (excluding high income)Sub-Saharan Africa (IDA & IBRD countries)SudanSurinameSwazilandSwedenSwitzerlandSyrian Arab RepublicTajikistanTanzaniaThailandTimor-LesteTogoTongaTrinidad and TobagoTunisiaTurkeyTurkmenistanUgandaUkraineUnited Arab EmiratesUnited KingdomUnited StatesUpper middle incomeUruguayUzbekistanVanuatuVenezuela, RBVietnamVirgin Islands (U.S.)West Bank and GazaWorldYemen, Rep.ZambiaZimbabwe Timeline:
This timeline shows a graph from 1961 to 2016 of Hungary. No data until 1960. Number of actual observations by date: 56.
Source name:
World Development Indicators
Source organization:
United Nations Population Division, World Population Prospects.
Categories, topics:
Health, Gender, Social Development
Last updated:
apr 23, 2017
Indicators value changes by year
Minimum:
17.707
jan 1, 2016
At the date of observation
Value
Absolute change
Change from previous value
jan 1, 1961
50.198
+50.198
0.0%
jan 1, 1962
48.52
-1.679
-3.34%
jan 1, 1963
46.841
-1.679
-3.46%
jan 1, 1964
47.712
+0.871
1.86%
jan 1, 1965
48.583
+0.871
1.83%
jan 1, 1966
49.454
+0.871
1.79%
jan 1, 1967
50.325
+0.871
1.76%
jan 1, 1968
51.196
+0.871
1.73%
jan 1, 1969
52.202
+1.006
1.96%
jan 1, 1970
53.208
+1.006
1.93%
jan 1, 1971
54.213
+1.006
1.89%
jan 1, 1972
55.219
+1.006
1.86%
jan 1, 1973
56.225
+1.006
1.82%
jan 1, 1974
58.998
+2.773
4.93%
jan 1, 1975
61.771
+2.773
4.7%
jan 1, 1976
64.544
+2.773
4.49%
jan 1, 1977
67.317
+2.773
4.3%
jan 1, 1978
70.09
+2.773
4.12%
jan 1, 1979
67.869
-2.221
-3.17%
jan 1, 1980
65.649
-2.221
-3.27%
jan 1, 1981
63.428
-2.221
-3.38%
jan 1, 1982
61.208
-2.221
-3.5%
jan 1, 1983
58.987
-2.221
-3.63%
jan 1, 1984
56.52
-2.467
-4.18%
jan 1, 1985
54.052
-2.467
-4.37%
jan 1, 1986
51.585
-2.467
-4.56%
jan 1, 1987
49.117
-2.467
-4.78%
jan 1, 1988
46.65
-2.467
-5.02%
jan 1, 1989
44.626
-2.024
-4.34%
jan 1, 1990
42.602
-2.024
-4.54%
jan 1, 1991
40.579
-2.024
-4.75%
jan 1, 1992
38.555
-2.024
-4.99%
jan 1, 1993
36.531
-2.024
-5.25%
jan 1, 1994
34.343
-2.188
-5.99%
jan 1, 1995
32.155
-2.188
-6.37%
jan 1, 1996
29.967
-2.188
-6.8%
jan 1, 1997
27.779
-2.188
-7.3%
jan 1, 1998
25.591
-2.188
-7.88%
jan 1, 1999
24.676
-0.915
-3.57%
jan 1, 2000
23.762
-0.915
-3.71%
jan 1, 2001
22.847
-0.915
-3.85%
jan 1, 2002
21.933
-0.915
-4.0%
jan 1, 2003
21.018
-0.915
-4.17%
jan 1, 2004
20.729
-0.289
-1.38%
jan 1, 2005
20.44
-0.289
-1.39%
jan 1, 2006
20.151
-0.289
-1.41%
jan 1, 2007
19.862
-0.289
-1.43%
jan 1, 2008
19.573
-0.289
-1.46%
jan 1, 2009
19.503
-0.07
-0.36%
jan 1, 2010
19.433
-0.07
-0.36%
jan 1, 2011
19.363
-0.07
-0.36%
jan 1, 2012
19.293
-0.07
-0.36%
jan 1, 2013
19.223
-0.07
-0.36%
jan 1, 2014
18.718
-0.505
-2.63%
jan 1, 2015
18.213
-0.505
-2.7%
jan 1, 2016
17.707
-0.505
-2.77%
Ranking of countries by current statistics by years


Comments: