29
/
en
AIzaSyAYiBZKx7MnpbEhh9jyipgxe19OcubqV5w
April 1, 2024
283166
Virgin Islands (U.S.)
VIR
true
2
1
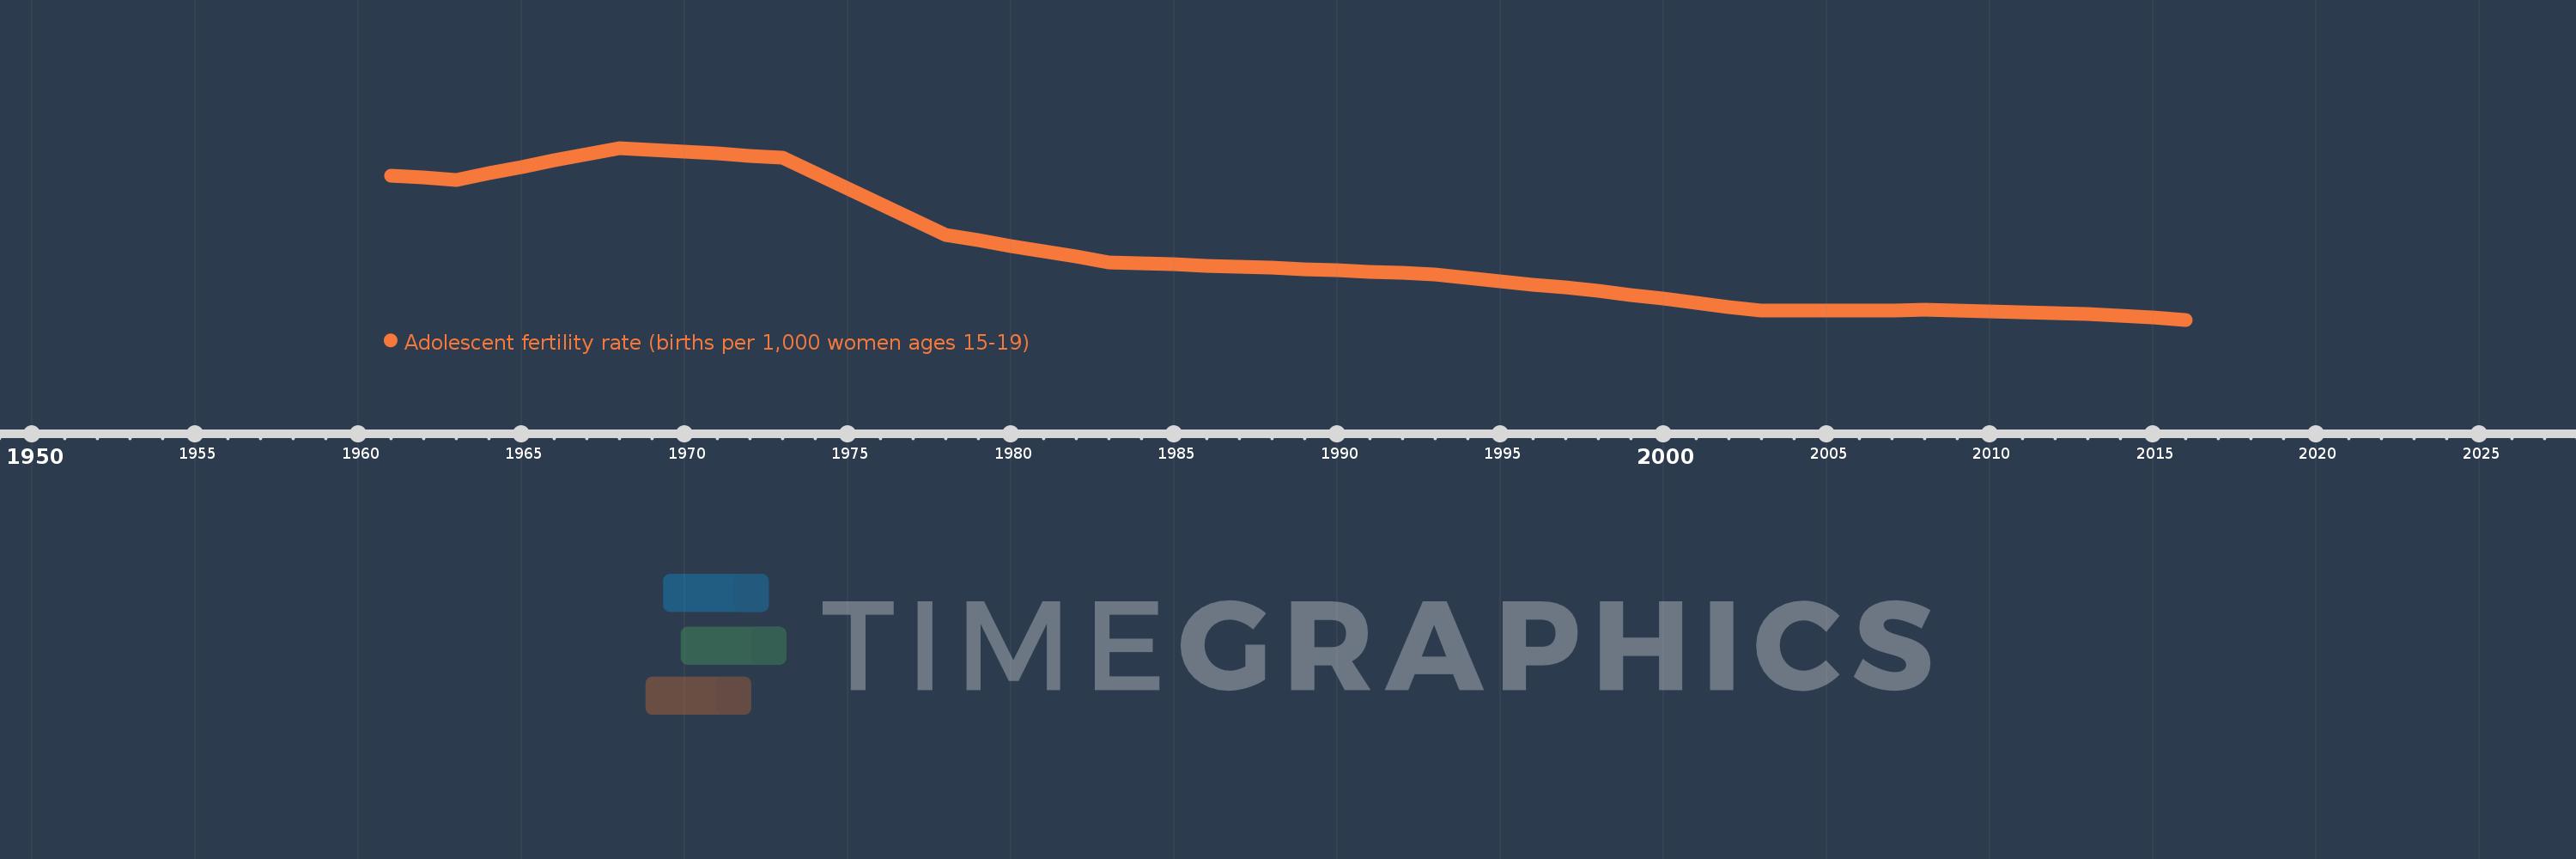
Adolescent fertility rate (births per 1,000 women ages 15-19)
2016,2015,2014,2013,2012,2011,2010,2009,2008,2007,2006,2005,2004,2003,2002,2001,2000,1999,1998,1997,1996,1995,1994,1993,1992,1991,1990,1989,1988,1987,1986,1985,1984,1983,1982,1981,1980,1979,1978,1977,1976,1975,1974,1973,1972,1971,1970,1969,1968,1967,1966,1965,1964,1963,1962,1961
This statistics in other country:
AfghanistanAlbaniaAlgeriaAngolaAntigua and BarbudaArab WorldArgentinaArmeniaArubaAustraliaAustriaAzerbaijanBahamas, TheBahrainBangladeshBarbadosBelarusBelgiumBelizeBeninBhutanBoliviaBosnia and HerzegovinaBotswanaBrazilBrunei DarussalamBulgariaBurkina FasoBurundiCabo VerdeCambodiaCameroonCanadaCaribbean small statesCentral African RepublicCentral Europe and the BalticsChadChannel IslandsChileChinaColombiaComorosCongo, Dem. Rep.Congo, Rep.Costa RicaCote d'IvoireCroatiaCubaCuracaoCyprusCzech RepublicDenmarkDjiboutiDominican RepublicEarly-demographic dividendEast Asia & PacificEast Asia & Pacific (excluding high income)East Asia & Pacific (IDA & IBRD countries)EcuadorEgypt, Arab Rep.El SalvadorEquatorial GuineaEritreaEstoniaEthiopiaEuro areaEurope & Central AsiaEurope & Central Asia (excluding high income)Europe & Central Asia (IDA & IBRD countries)European UnionFijiFinlandFragile and conflict affected situationsFranceFrench PolynesiaGabonGambia, TheGeorgiaGermanyGhanaGreeceGrenadaGuamGuatemalaGuineaGuinea-BissauGuyanaHaitiHeavily indebted poor countries (HIPC)High incomeHondurasHong Kong SAR, ChinaHungaryIBRD onlyIcelandIDA & IBRD totalIDA blendIDA onlyIDA totalIndiaIndonesiaIran, Islamic Rep.IraqIrelandIsraelItalyJamaicaJapanJordanKazakhstanKenyaKiribatiKorea, Dem. People’s Rep.Korea, Rep.KuwaitKyrgyz RepublicLao PDRLate-demographic dividendLatin America & Caribbean Latin America & Caribbean (excluding high income)Latin America & the Caribbean (IDA & IBRD countries)LatviaLeast developed countries: UN classificationLebanonLesothoLiberiaLibyaLithuaniaLow & middle incomeLow incomeLower middle incomeLuxembourgMacao SAR, ChinaMacedonia, FYRMadagascarMalawiMalaysiaMaldivesMaliMaltaMauritaniaMauritiusMexicoMicronesia, Fed. Sts.Middle East & North AfricaMiddle East & North Africa (excluding high income)Middle East & North Africa (IDA & IBRD countries)Middle incomeMoldovaMongoliaMontenegroMoroccoMozambiqueMyanmarNamibiaNepalNetherlandsNew CaledoniaNew ZealandNicaraguaNigerNigeriaNorth AmericaNorwayOECD membersOmanOther small statesPacific island small statesPakistanPanamaPapua New GuineaParaguayPeruPhilippinesPolandPortugalPost-demographic dividendPre-demographic dividendPuerto RicoQatarRomaniaRussian FederationRwandaSamoaSao Tome and PrincipeSaudi ArabiaSenegalSerbiaSeychellesSierra LeoneSingaporeSlovak RepublicSloveniaSmall statesSolomon IslandsSomaliaSouth AfricaSouth AsiaSouth Asia (IDA & IBRD)South SudanSpainSri LankaSt. LuciaSt. Vincent and the GrenadinesSub-Saharan Africa Sub-Saharan Africa (excluding high income)Sub-Saharan Africa (IDA & IBRD countries)SudanSurinameSwazilandSwedenSwitzerlandSyrian Arab RepublicTajikistanTanzaniaThailandTimor-LesteTogoTongaTrinidad and TobagoTunisiaTurkeyTurkmenistanUgandaUkraineUnited Arab EmiratesUnited KingdomUnited StatesUpper middle incomeUruguayUzbekistanVanuatuVenezuela, RBVietnamVirgin Islands (U.S.)West Bank and GazaWorldYemen, Rep.ZambiaZimbabwe Timeline:
This timeline shows a graph from 1961 to 2016 of Virgin Islands (U.S.). No data until 1960. Number of actual observations by date: 56.
Source name:
World Development Indicators
Source organization:
United Nations Population Division, World Population Prospects.
Categories, topics:
Health, Gender, Social Development
Last updated:
apr 23, 2017
Indicators value changes by year
Minimum:
42.644
jan 1, 2016
Maximum:
173.108
jan 1, 1968
At the date of observation
Value
Absolute change
Change from previous value
jan 1, 1961
152.158
+152.158
0.0%
jan 1, 1962
150.614
-1.544
-1.01%
jan 1, 1963
149.07
-1.544
-1.03%
jan 1, 1964
153.878
+4.808
3.23%
jan 1, 1965
158.685
+4.808
3.12%
jan 1, 1966
163.493
+4.808
3.03%
jan 1, 1967
168.3
+4.808
2.94%
jan 1, 1968
173.108
+4.808
2.86%
jan 1, 1969
171.649
-1.459
-0.84%
jan 1, 1970
170.19
-1.459
-0.85%
jan 1, 1971
168.732
-1.459
-0.86%
jan 1, 1972
167.273
-1.459
-0.86%
jan 1, 1973
165.814
-1.459
-0.87%
jan 1, 1974
154.065
-11.749
-7.09%
jan 1, 1975
142.315
-11.749
-7.63%
jan 1, 1976
130.566
-11.749
-8.26%
jan 1, 1977
118.816
-11.749
-9.0%
jan 1, 1978
107.067
-11.749
-9.89%
jan 1, 1979
102.933
-4.134
-3.86%
jan 1, 1980
98.798
-4.134
-4.02%
jan 1, 1981
94.664
-4.134
-4.18%
jan 1, 1982
90.529
-4.134
-4.37%
jan 1, 1983
86.395
-4.134
-4.57%
jan 1, 1984
85.531
-0.864
-1.0%
jan 1, 1985
84.666
-0.864
-1.01%
jan 1, 1986
83.802
-0.864
-1.02%
jan 1, 1987
82.937
-0.864
-1.03%
jan 1, 1988
82.073
-0.864
-1.04%
jan 1, 1989
81.063
-1.01
-1.23%
jan 1, 1990
80.052
-1.01
-1.25%
jan 1, 1991
79.042
-1.01
-1.26%
jan 1, 1992
78.031
-1.01
-1.28%
jan 1, 1993
77.021
-1.01
-1.29%
jan 1, 1994
74.519
-2.502
-3.25%
jan 1, 1995
72.016
-2.502
-3.36%
jan 1, 1996
69.514
-2.502
-3.47%
jan 1, 1997
67.011
-2.502
-3.6%
jan 1, 1998
64.509
-2.502
-3.73%
jan 1, 1999
61.496
-3.013
-4.67%
jan 1, 2000
58.483
-3.013
-4.9%
jan 1, 2001
55.47
-3.013
-5.15%
jan 1, 2002
52.457
-3.013
-5.43%
jan 1, 2003
49.444
-3.013
-5.74%
jan 1, 2004
49.545
+0.101
0.2%
jan 1, 2005
49.646
+0.101
0.2%
jan 1, 2006
49.748
+0.101
0.2%
jan 1, 2007
49.849
+0.101
0.2%
jan 1, 2008
49.95
+0.101
0.2%
jan 1, 2009
49.417
-0.533
-1.07%
jan 1, 2010
48.883
-0.533
-1.08%
jan 1, 2011
48.35
-0.533
-1.09%
jan 1, 2012
47.816
-0.533
-1.1%
jan 1, 2013
47.283
-0.533
-1.12%
jan 1, 2014
45.737
-1.546
-3.27%
jan 1, 2015
44.19
-1.546
-3.38%
jan 1, 2016
42.644
-1.546
-3.5%
Ranking of countries by current statistics by years


Comments: