29
/
en
AIzaSyAYiBZKx7MnpbEhh9jyipgxe19OcubqV5w
April 1, 2024
46829
Lower middle income
LMC
false
2
1
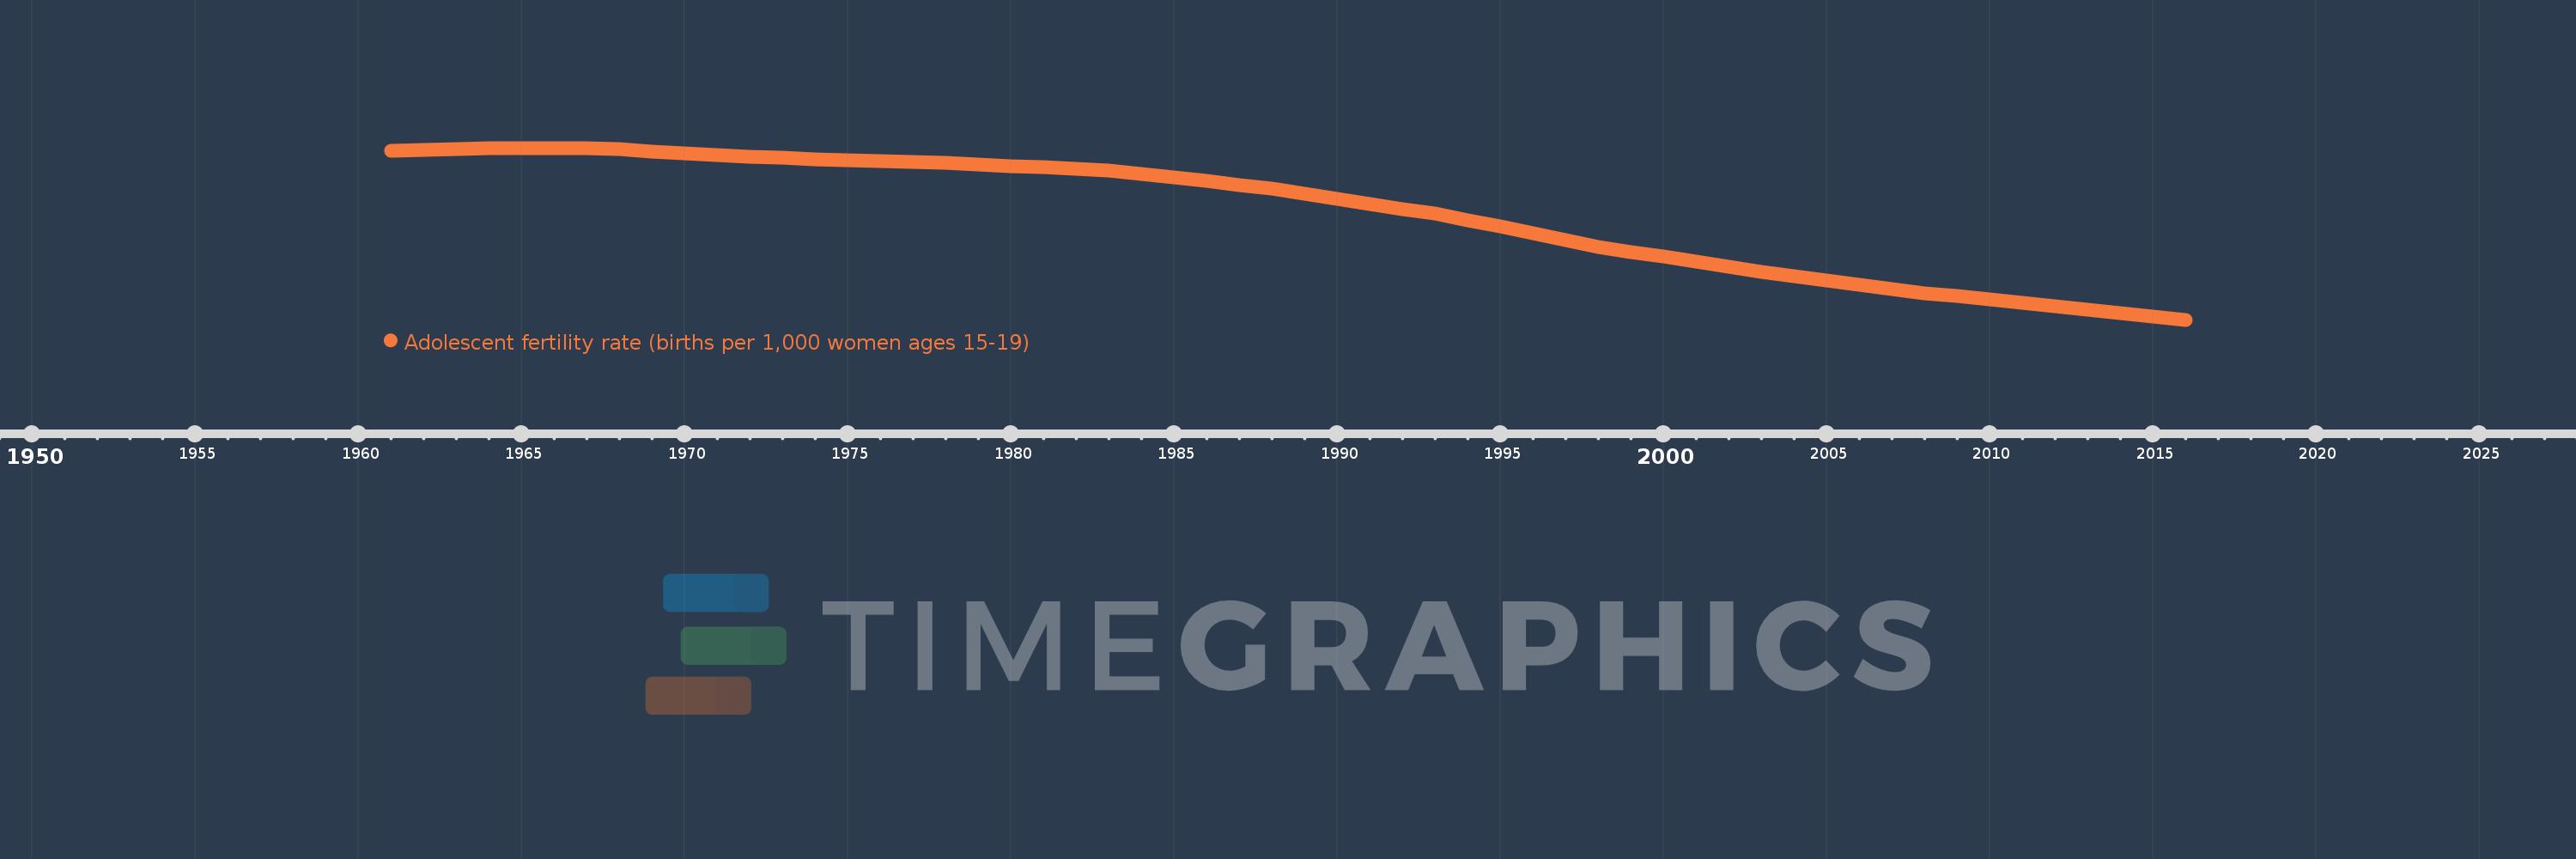
Adolescent fertility rate (births per 1,000 women ages 15-19)
2016,2015,2014,2013,2012,2011,2010,2009,2008,2007,2006,2005,2004,2003,2002,2001,2000,1999,1998,1997,1996,1995,1994,1993,1992,1991,1990,1989,1988,1987,1986,1985,1984,1983,1982,1981,1980,1979,1978,1977,1976,1975,1974,1973,1972,1971,1970,1969,1968,1967,1966,1965,1964,1963,1962,1961
This statistics in other country:
AfghanistanAlbaniaAlgeriaAngolaAntigua and BarbudaArab WorldArgentinaArmeniaArubaAustraliaAustriaAzerbaijanBahamas, TheBahrainBangladeshBarbadosBelarusBelgiumBelizeBeninBhutanBoliviaBosnia and HerzegovinaBotswanaBrazilBrunei DarussalamBulgariaBurkina FasoBurundiCabo VerdeCambodiaCameroonCanadaCaribbean small statesCentral African RepublicCentral Europe and the BalticsChadChannel IslandsChileChinaColombiaComorosCongo, Dem. Rep.Congo, Rep.Costa RicaCote d'IvoireCroatiaCubaCuracaoCyprusCzech RepublicDenmarkDjiboutiDominican RepublicEarly-demographic dividendEast Asia & PacificEast Asia & Pacific (excluding high income)East Asia & Pacific (IDA & IBRD countries)EcuadorEgypt, Arab Rep.El SalvadorEquatorial GuineaEritreaEstoniaEthiopiaEuro areaEurope & Central AsiaEurope & Central Asia (excluding high income)Europe & Central Asia (IDA & IBRD countries)European UnionFijiFinlandFragile and conflict affected situationsFranceFrench PolynesiaGabonGambia, TheGeorgiaGermanyGhanaGreeceGrenadaGuamGuatemalaGuineaGuinea-BissauGuyanaHaitiHeavily indebted poor countries (HIPC)High incomeHondurasHong Kong SAR, ChinaHungaryIBRD onlyIcelandIDA & IBRD totalIDA blendIDA onlyIDA totalIndiaIndonesiaIran, Islamic Rep.IraqIrelandIsraelItalyJamaicaJapanJordanKazakhstanKenyaKiribatiKorea, Dem. People’s Rep.Korea, Rep.KuwaitKyrgyz RepublicLao PDRLate-demographic dividendLatin America & Caribbean Latin America & Caribbean (excluding high income)Latin America & the Caribbean (IDA & IBRD countries)LatviaLeast developed countries: UN classificationLebanonLesothoLiberiaLibyaLithuaniaLow & middle incomeLow incomeLower middle incomeLuxembourgMacao SAR, ChinaMacedonia, FYRMadagascarMalawiMalaysiaMaldivesMaliMaltaMauritaniaMauritiusMexicoMicronesia, Fed. Sts.Middle East & North AfricaMiddle East & North Africa (excluding high income)Middle East & North Africa (IDA & IBRD countries)Middle incomeMoldovaMongoliaMontenegroMoroccoMozambiqueMyanmarNamibiaNepalNetherlandsNew CaledoniaNew ZealandNicaraguaNigerNigeriaNorth AmericaNorwayOECD membersOmanOther small statesPacific island small statesPakistanPanamaPapua New GuineaParaguayPeruPhilippinesPolandPortugalPost-demographic dividendPre-demographic dividendPuerto RicoQatarRomaniaRussian FederationRwandaSamoaSao Tome and PrincipeSaudi ArabiaSenegalSerbiaSeychellesSierra LeoneSingaporeSlovak RepublicSloveniaSmall statesSolomon IslandsSomaliaSouth AfricaSouth AsiaSouth Asia (IDA & IBRD)South SudanSpainSri LankaSt. LuciaSt. Vincent and the GrenadinesSub-Saharan Africa Sub-Saharan Africa (excluding high income)Sub-Saharan Africa (IDA & IBRD countries)SudanSurinameSwazilandSwedenSwitzerlandSyrian Arab RepublicTajikistanTanzaniaThailandTimor-LesteTogoTongaTrinidad and TobagoTunisiaTurkeyTurkmenistanUgandaUkraineUnited Arab EmiratesUnited KingdomUnited StatesUpper middle incomeUruguayUzbekistanVanuatuVenezuela, RBVietnamVirgin Islands (U.S.)West Bank and GazaWorldYemen, Rep.ZambiaZimbabwe Timeline:
This timeline shows a graph from 1961 to 2016 of Lower middle income. No data until 1960. Number of actual observations by date: 56.
Source name:
World Development Indicators
Source organization:
United Nations Population Division, World Population Prospects.
Categories, topics:
Health, Gender, Social Development
Last updated:
apr 23, 2017
Indicators value changes by year
Minimum:
45.332
jan 1, 2016
Maximum:
116.139
jan 1, 1965
At the date of observation
Value
Absolute change
Change from previous value
jan 1, 1961
114.82
+114.82
0.0%
jan 1, 1962
115.382
+0.561
0.49%
jan 1, 1963
115.804
+0.422
0.37%
jan 1, 1964
116.049
+0.245
0.21%
jan 1, 1965
116.139
+0.09
0.08%
jan 1, 1966
116.107
-0.032
-0.03%
jan 1, 1967
115.927
-0.18
-0.15%
jan 1, 1968
115.65
-0.277
-0.24%
jan 1, 1969
114.695
-0.955
-0.83%
jan 1, 1970
113.879
-0.816
-0.71%
jan 1, 1971
113.245
-0.634
-0.56%
jan 1, 1972
112.567
-0.678
-0.6%
jan 1, 1973
112.048
-0.519
-0.46%
jan 1, 1974
111.504
-0.544
-0.49%
jan 1, 1975
111.026
-0.478
-0.43%
jan 1, 1976
110.571
-0.455
-0.41%
jan 1, 1977
110.222
-0.349
-0.32%
jan 1, 1978
109.877
-0.345
-0.31%
jan 1, 1979
109.315
-0.562
-0.51%
jan 1, 1980
108.744
-0.572
-0.52%
jan 1, 1981
108.16
-0.584
-0.54%
jan 1, 1982
107.526
-0.634
-0.59%
jan 1, 1983
106.891
-0.635
-0.59%
jan 1, 1984
105.459
-1.432
-1.34%
jan 1, 1985
103.983
-1.476
-1.4%
jan 1, 1986
102.455
-1.527
-1.47%
jan 1, 1987
100.876
-1.579
-1.54%
jan 1, 1988
99.273
-1.603
-1.59%
jan 1, 1989
97.176
-2.097
-2.11%
jan 1, 1990
95.102
-2.074
-2.13%
jan 1, 1991
93.078
-2.024
-2.13%
jan 1, 1992
91.044
-2.034
-2.19%
jan 1, 1993
89.03
-2.014
-2.21%
jan 1, 1994
86.361
-2.669
-3.0%
jan 1, 1995
83.667
-2.694
-3.12%
jan 1, 1996
80.936
-2.731
-3.26%
jan 1, 1997
78.175
-2.761
-3.41%
jan 1, 1998
75.377
-2.798
-3.58%
jan 1, 1999
73.319
-2.057
-2.73%
jan 1, 2000
71.256
-2.063
-2.81%
jan 1, 2001
69.201
-2.055
-2.88%
jan 1, 2002
67.156
-2.045
-2.95%
jan 1, 2003
65.117
-2.039
-3.04%
jan 1, 2004
63.339
-1.778
-2.73%
jan 1, 2005
61.572
-1.767
-2.79%
jan 1, 2006
59.82
-1.752
-2.85%
jan 1, 2007
58.082
-1.738
-2.91%
jan 1, 2008
56.361
-1.721
-2.96%
jan 1, 2009
54.984
-1.378
-2.44%
jan 1, 2010
53.616
-1.368
-2.49%
jan 1, 2011
52.248
-1.368
-2.55%
jan 1, 2012
50.88
-1.368
-2.62%
jan 1, 2013
49.511
-1.369
-2.69%
jan 1, 2014
48.125
-1.385
-2.8%
jan 1, 2015
46.732
-1.394
-2.9%
jan 1, 2016
45.332
-1.4
-2.99%
Ranking of countries by current statistics by years


Comments: