29
/
en
AIzaSyAYiBZKx7MnpbEhh9jyipgxe19OcubqV5w
April 1, 2024
245187
South Africa
ZAF
true
2
1
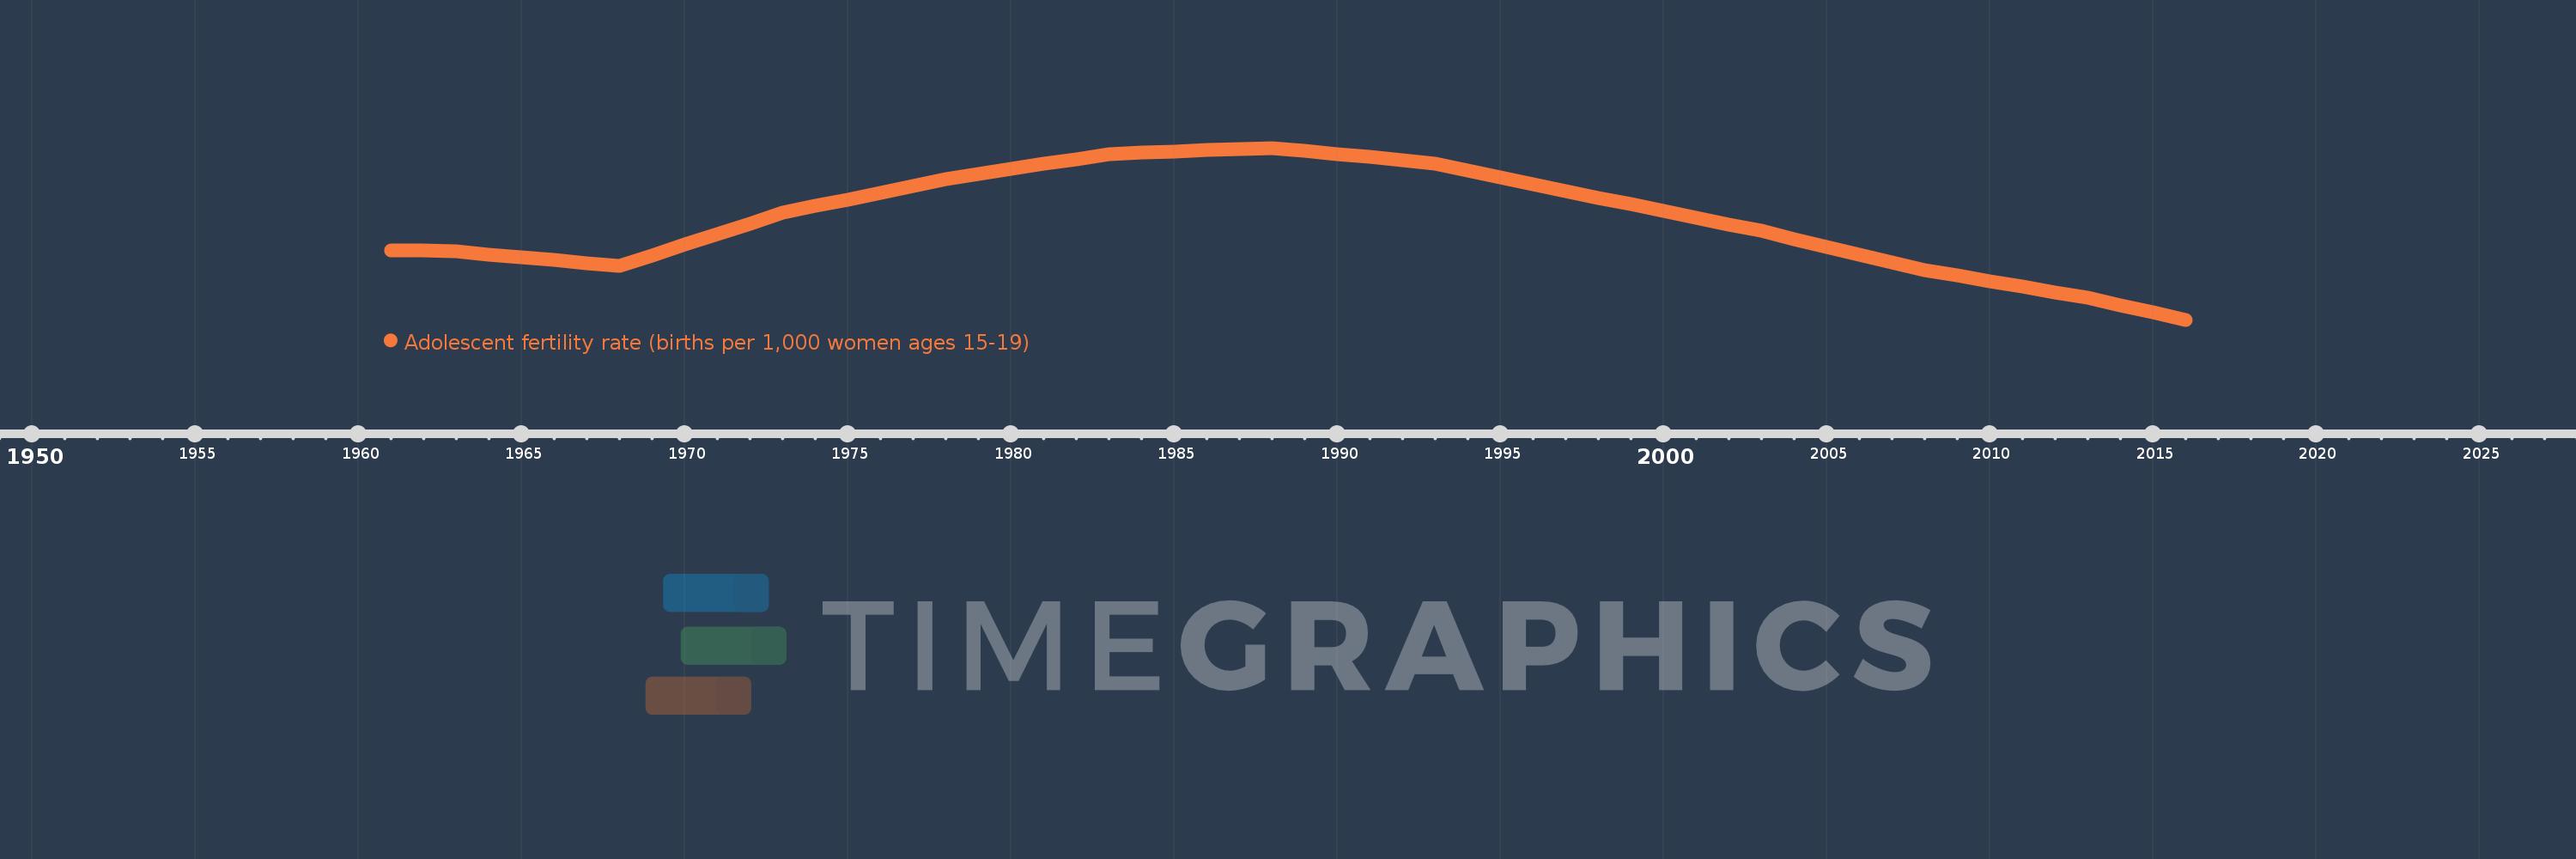
Adolescent fertility rate (births per 1,000 women ages 15-19)
2016,2015,2014,2013,2012,2011,2010,2009,2008,2007,2006,2005,2004,2003,2002,2001,2000,1999,1998,1997,1996,1995,1994,1993,1992,1991,1990,1989,1988,1987,1986,1985,1984,1983,1982,1981,1980,1979,1978,1977,1976,1975,1974,1973,1972,1971,1970,1969,1968,1967,1966,1965,1964,1963,1962,1961
This statistics in other country:
AfghanistanAlbaniaAlgeriaAngolaAntigua and BarbudaArab WorldArgentinaArmeniaArubaAustraliaAustriaAzerbaijanBahamas, TheBahrainBangladeshBarbadosBelarusBelgiumBelizeBeninBhutanBoliviaBosnia and HerzegovinaBotswanaBrazilBrunei DarussalamBulgariaBurkina FasoBurundiCabo VerdeCambodiaCameroonCanadaCaribbean small statesCentral African RepublicCentral Europe and the BalticsChadChannel IslandsChileChinaColombiaComorosCongo, Dem. Rep.Congo, Rep.Costa RicaCote d'IvoireCroatiaCubaCuracaoCyprusCzech RepublicDenmarkDjiboutiDominican RepublicEarly-demographic dividendEast Asia & PacificEast Asia & Pacific (excluding high income)East Asia & Pacific (IDA & IBRD countries)EcuadorEgypt, Arab Rep.El SalvadorEquatorial GuineaEritreaEstoniaEthiopiaEuro areaEurope & Central AsiaEurope & Central Asia (excluding high income)Europe & Central Asia (IDA & IBRD countries)European UnionFijiFinlandFragile and conflict affected situationsFranceFrench PolynesiaGabonGambia, TheGeorgiaGermanyGhanaGreeceGrenadaGuamGuatemalaGuineaGuinea-BissauGuyanaHaitiHeavily indebted poor countries (HIPC)High incomeHondurasHong Kong SAR, ChinaHungaryIBRD onlyIcelandIDA & IBRD totalIDA blendIDA onlyIDA totalIndiaIndonesiaIran, Islamic Rep.IraqIrelandIsraelItalyJamaicaJapanJordanKazakhstanKenyaKiribatiKorea, Dem. People’s Rep.Korea, Rep.KuwaitKyrgyz RepublicLao PDRLate-demographic dividendLatin America & Caribbean Latin America & Caribbean (excluding high income)Latin America & the Caribbean (IDA & IBRD countries)LatviaLeast developed countries: UN classificationLebanonLesothoLiberiaLibyaLithuaniaLow & middle incomeLow incomeLower middle incomeLuxembourgMacao SAR, ChinaMacedonia, FYRMadagascarMalawiMalaysiaMaldivesMaliMaltaMauritaniaMauritiusMexicoMicronesia, Fed. Sts.Middle East & North AfricaMiddle East & North Africa (excluding high income)Middle East & North Africa (IDA & IBRD countries)Middle incomeMoldovaMongoliaMontenegroMoroccoMozambiqueMyanmarNamibiaNepalNetherlandsNew CaledoniaNew ZealandNicaraguaNigerNigeriaNorth AmericaNorwayOECD membersOmanOther small statesPacific island small statesPakistanPanamaPapua New GuineaParaguayPeruPhilippinesPolandPortugalPost-demographic dividendPre-demographic dividendPuerto RicoQatarRomaniaRussian FederationRwandaSamoaSao Tome and PrincipeSaudi ArabiaSenegalSerbiaSeychellesSierra LeoneSingaporeSlovak RepublicSloveniaSmall statesSolomon IslandsSomaliaSouth AfricaSouth AsiaSouth Asia (IDA & IBRD)South SudanSpainSri LankaSt. LuciaSt. Vincent and the GrenadinesSub-Saharan Africa Sub-Saharan Africa (excluding high income)Sub-Saharan Africa (IDA & IBRD countries)SudanSurinameSwazilandSwedenSwitzerlandSyrian Arab RepublicTajikistanTanzaniaThailandTimor-LesteTogoTongaTrinidad and TobagoTunisiaTurkeyTurkmenistanUgandaUkraineUnited Arab EmiratesUnited KingdomUnited StatesUpper middle incomeUruguayUzbekistanVanuatuVenezuela, RBVietnamVirgin Islands (U.S.)West Bank and GazaWorldYemen, Rep.ZambiaZimbabwe Timeline:
This timeline shows a graph from 1961 to 2016 of South Africa. No data until 1960. Number of actual observations by date: 56.
Source name:
World Development Indicators
Source organization:
United Nations Population Division, World Population Prospects.
Categories, topics:
Health, Gender, Social Development
Last updated:
apr 23, 2017
Indicators value changes by year
At the date of observation
Value
Absolute change
Change from previous value
jan 1, 1961
65.084
+65.084
0.0%
jan 1, 1962
64.872
-0.212
-0.33%
jan 1, 1963
64.66
-0.212
-0.33%
jan 1, 1964
63.812
-0.848
-1.31%
jan 1, 1965
62.964
-0.848
-1.33%
jan 1, 1966
62.116
-0.848
-1.35%
jan 1, 1967
61.268
-0.848
-1.37%
jan 1, 1968
60.42
-0.848
-1.38%
jan 1, 1969
63.564
+3.144
5.2%
jan 1, 1970
66.709
+3.144
4.95%
jan 1, 1971
69.853
+3.144
4.71%
jan 1, 1972
72.998
+3.144
4.5%
jan 1, 1973
76.142
+3.144
4.31%
jan 1, 1974
78.134
+1.992
2.62%
jan 1, 1975
80.125
+1.992
2.55%
jan 1, 1976
82.117
+1.992
2.49%
jan 1, 1977
84.108
+1.992
2.43%
jan 1, 1978
86.1
+1.992
2.37%
jan 1, 1979
87.596
+1.496
1.74%
jan 1, 1980
89.092
+1.496
1.71%
jan 1, 1981
90.588
+1.496
1.68%
jan 1, 1982
92.084
+1.496
1.65%
jan 1, 1983
93.58
+1.496
1.62%
jan 1, 1984
93.936
+0.356
0.38%
jan 1, 1985
94.292
+0.356
0.38%
jan 1, 1986
94.648
+0.356
0.38%
jan 1, 1987
95.004
+0.356
0.38%
jan 1, 1988
95.36
+0.356
0.37%
jan 1, 1989
94.447
-0.913
-0.96%
jan 1, 1990
93.534
-0.913
-0.97%
jan 1, 1991
92.622
-0.913
-0.98%
jan 1, 1992
91.709
-0.913
-0.99%
jan 1, 1993
90.796
-0.913
-1.0%
jan 1, 1994
88.754
-2.042
-2.25%
jan 1, 1995
86.712
-2.042
-2.3%
jan 1, 1996
84.669
-2.042
-2.36%
jan 1, 1997
82.627
-2.042
-2.41%
jan 1, 1998
80.585
-2.042
-2.47%
jan 1, 1999
78.612
-1.973
-2.45%
jan 1, 2000
76.64
-1.973
-2.51%
jan 1, 2001
74.667
-1.973
-2.57%
jan 1, 2002
72.695
-1.973
-2.64%
jan 1, 2003
70.722
-1.973
-2.71%
jan 1, 2004
68.41
-2.312
-3.27%
jan 1, 2005
66.097
-2.312
-3.38%
jan 1, 2006
63.785
-2.312
-3.5%
jan 1, 2007
61.472
-2.312
-3.63%
jan 1, 2008
59.16
-2.312
-3.76%
jan 1, 2009
57.5
-1.66
-2.81%
jan 1, 2010
55.841
-1.66
-2.89%
jan 1, 2011
54.181
-1.66
-2.97%
jan 1, 2012
52.522
-1.66
-3.06%
jan 1, 2013
50.862
-1.66
-3.16%
jan 1, 2014
48.721
-2.141
-4.21%
jan 1, 2015
46.581
-2.141
-4.39%
jan 1, 2016
44.44
-2.141
-4.6%
Ranking of countries by current statistics by years


Comments: