29
/
en
AIzaSyAYiBZKx7MnpbEhh9jyipgxe19OcubqV5w
April 1, 2024
23875
Arab World
ARB
false
2
1
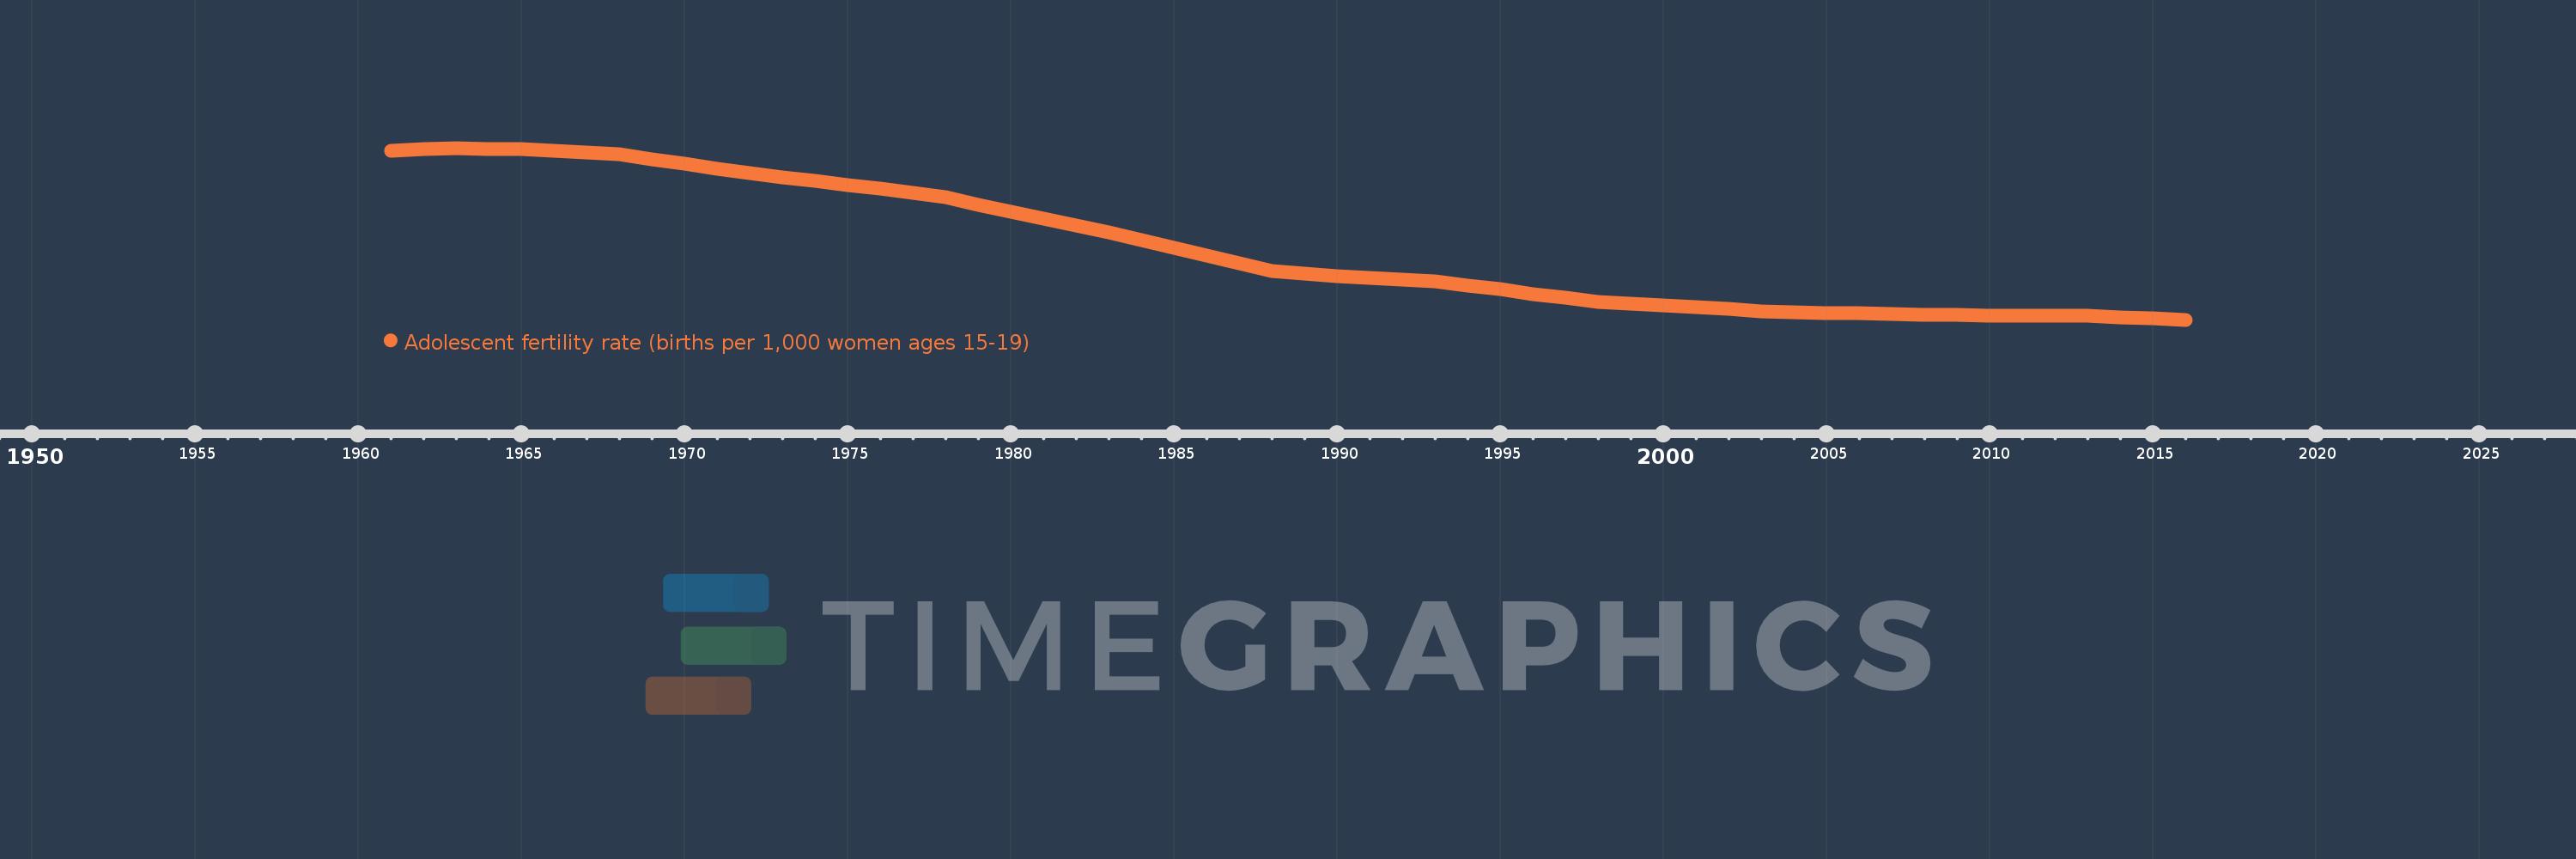
Adolescent fertility rate (births per 1,000 women ages 15-19)
2016,2015,2014,2013,2012,2011,2010,2009,2008,2007,2006,2005,2004,2003,2002,2001,2000,1999,1998,1997,1996,1995,1994,1993,1992,1991,1990,1989,1988,1987,1986,1985,1984,1983,1982,1981,1980,1979,1978,1977,1976,1975,1974,1973,1972,1971,1970,1969,1968,1967,1966,1965,1964,1963,1962,1961
This statistics in other country:
AfghanistanAlbaniaAlgeriaAngolaAntigua and BarbudaArab WorldArgentinaArmeniaArubaAustraliaAustriaAzerbaijanBahamas, TheBahrainBangladeshBarbadosBelarusBelgiumBelizeBeninBhutanBoliviaBosnia and HerzegovinaBotswanaBrazilBrunei DarussalamBulgariaBurkina FasoBurundiCabo VerdeCambodiaCameroonCanadaCaribbean small statesCentral African RepublicCentral Europe and the BalticsChadChannel IslandsChileChinaColombiaComorosCongo, Dem. Rep.Congo, Rep.Costa RicaCote d'IvoireCroatiaCubaCuracaoCyprusCzech RepublicDenmarkDjiboutiDominican RepublicEarly-demographic dividendEast Asia & PacificEast Asia & Pacific (excluding high income)East Asia & Pacific (IDA & IBRD countries)EcuadorEgypt, Arab Rep.El SalvadorEquatorial GuineaEritreaEstoniaEthiopiaEuro areaEurope & Central AsiaEurope & Central Asia (excluding high income)Europe & Central Asia (IDA & IBRD countries)European UnionFijiFinlandFragile and conflict affected situationsFranceFrench PolynesiaGabonGambia, TheGeorgiaGermanyGhanaGreeceGrenadaGuamGuatemalaGuineaGuinea-BissauGuyanaHaitiHeavily indebted poor countries (HIPC)High incomeHondurasHong Kong SAR, ChinaHungaryIBRD onlyIcelandIDA & IBRD totalIDA blendIDA onlyIDA totalIndiaIndonesiaIran, Islamic Rep.IraqIrelandIsraelItalyJamaicaJapanJordanKazakhstanKenyaKiribatiKorea, Dem. People’s Rep.Korea, Rep.KuwaitKyrgyz RepublicLao PDRLate-demographic dividendLatin America & Caribbean Latin America & Caribbean (excluding high income)Latin America & the Caribbean (IDA & IBRD countries)LatviaLeast developed countries: UN classificationLebanonLesothoLiberiaLibyaLithuaniaLow & middle incomeLow incomeLower middle incomeLuxembourgMacao SAR, ChinaMacedonia, FYRMadagascarMalawiMalaysiaMaldivesMaliMaltaMauritaniaMauritiusMexicoMicronesia, Fed. Sts.Middle East & North AfricaMiddle East & North Africa (excluding high income)Middle East & North Africa (IDA & IBRD countries)Middle incomeMoldovaMongoliaMontenegroMoroccoMozambiqueMyanmarNamibiaNepalNetherlandsNew CaledoniaNew ZealandNicaraguaNigerNigeriaNorth AmericaNorwayOECD membersOmanOther small statesPacific island small statesPakistanPanamaPapua New GuineaParaguayPeruPhilippinesPolandPortugalPost-demographic dividendPre-demographic dividendPuerto RicoQatarRomaniaRussian FederationRwandaSamoaSao Tome and PrincipeSaudi ArabiaSenegalSerbiaSeychellesSierra LeoneSingaporeSlovak RepublicSloveniaSmall statesSolomon IslandsSomaliaSouth AfricaSouth AsiaSouth Asia (IDA & IBRD)South SudanSpainSri LankaSt. LuciaSt. Vincent and the GrenadinesSub-Saharan Africa Sub-Saharan Africa (excluding high income)Sub-Saharan Africa (IDA & IBRD countries)SudanSurinameSwazilandSwedenSwitzerlandSyrian Arab RepublicTajikistanTanzaniaThailandTimor-LesteTogoTongaTrinidad and TobagoTunisiaTurkeyTurkmenistanUgandaUkraineUnited Arab EmiratesUnited KingdomUnited StatesUpper middle incomeUruguayUzbekistanVanuatuVenezuela, RBVietnamVirgin Islands (U.S.)West Bank and GazaWorldYemen, Rep.ZambiaZimbabwe Timeline:
This timeline shows a graph from 1961 to 2016 of Arab World. No data until 1960. Number of actual observations by date: 56.
Source name:
World Development Indicators
Source organization:
United Nations Population Division, World Population Prospects.
Categories, topics:
Health, Gender, Social Development
Last updated:
apr 23, 2017
Indicators value changes by year
Maximum:
134.858
jan 1, 1963
At the date of observation
Value
Absolute change
Change from previous value
jan 1, 1961
133.555
+133.555
0.0%
jan 1, 1962
134.159
+0.604
0.45%
jan 1, 1963
134.858
+0.699
0.52%
jan 1, 1964
134.505
-0.353
-0.26%
jan 1, 1965
134.105
-0.399
-0.3%
jan 1, 1966
133.57
-0.536
-0.4%
jan 1, 1967
132.676
-0.894
-0.67%
jan 1, 1968
131.666
-1.01
-0.76%
jan 1, 1969
129.191
-2.475
-1.88%
jan 1, 1970
126.737
-2.454
-1.9%
jan 1, 1971
124.383
-2.354
-1.86%
jan 1, 1972
122.133
-2.249
-1.81%
jan 1, 1973
120.02
-2.113
-1.73%
jan 1, 1974
118.088
-1.933
-1.61%
jan 1, 1975
116.133
-1.955
-1.66%
jan 1, 1976
114.101
-2.032
-1.75%
jan 1, 1977
111.98
-2.121
-1.86%
jan 1, 1978
109.784
-2.196
-1.96%
jan 1, 1979
106.033
-3.75
-3.42%
jan 1, 1980
102.342
-3.692
-3.48%
jan 1, 1981
98.739
-3.603
-3.52%
jan 1, 1982
95.241
-3.498
-3.54%
jan 1, 1983
91.791
-3.45
-3.62%
jan 1, 1984
88.001
-3.79
-4.13%
jan 1, 1985
84.207
-3.794
-4.31%
jan 1, 1986
80.359
-3.848
-4.57%
jan 1, 1987
76.442
-3.918
-4.88%
jan 1, 1988
72.515
-3.927
-5.14%
jan 1, 1989
71.171
-1.344
-1.85%
jan 1, 1990
69.889
-1.282
-1.8%
jan 1, 1991
69.004
-0.884
-1.27%
jan 1, 1992
67.756
-1.248
-1.81%
jan 1, 1993
66.928
-0.828
-1.22%
jan 1, 1994
64.949
-1.979
-2.96%
jan 1, 1995
62.923
-2.026
-3.12%
jan 1, 1996
60.707
-2.216
-3.52%
jan 1, 1997
58.597
-2.11
-3.48%
jan 1, 1998
56.44
-2.157
-3.68%
jan 1, 1999
55.532
-0.909
-1.61%
jan 1, 2000
54.659
-0.873
-1.57%
jan 1, 2001
53.831
-0.827
-1.51%
jan 1, 2002
52.902
-0.93
-1.73%
jan 1, 2003
51.991
-0.911
-1.72%
jan 1, 2004
51.523
-0.468
-0.9%
jan 1, 2005
51.103
-0.42
-0.81%
jan 1, 2006
50.733
-0.371
-0.73%
jan 1, 2007
50.329
-0.403
-0.8%
jan 1, 2008
50.0
-0.329
-0.65%
jan 1, 2009
49.887
-0.113
-0.23%
jan 1, 2010
49.781
-0.106
-0.21%
jan 1, 2011
49.673
-0.108
-0.22%
jan 1, 2012
49.536
-0.137
-0.28%
jan 1, 2013
49.384
-0.152
-0.31%
jan 1, 2014
48.797
-0.587
-1.19%
jan 1, 2015
48.196
-0.6
-1.23%
jan 1, 2016
47.55
-0.646
-1.34%
Ranking of countries by current statistics by years


Comments: