29
/
en
AIzaSyAYiBZKx7MnpbEhh9jyipgxe19OcubqV5w
April 1, 2024
111834
Costa Rica
CRI
true
2
1
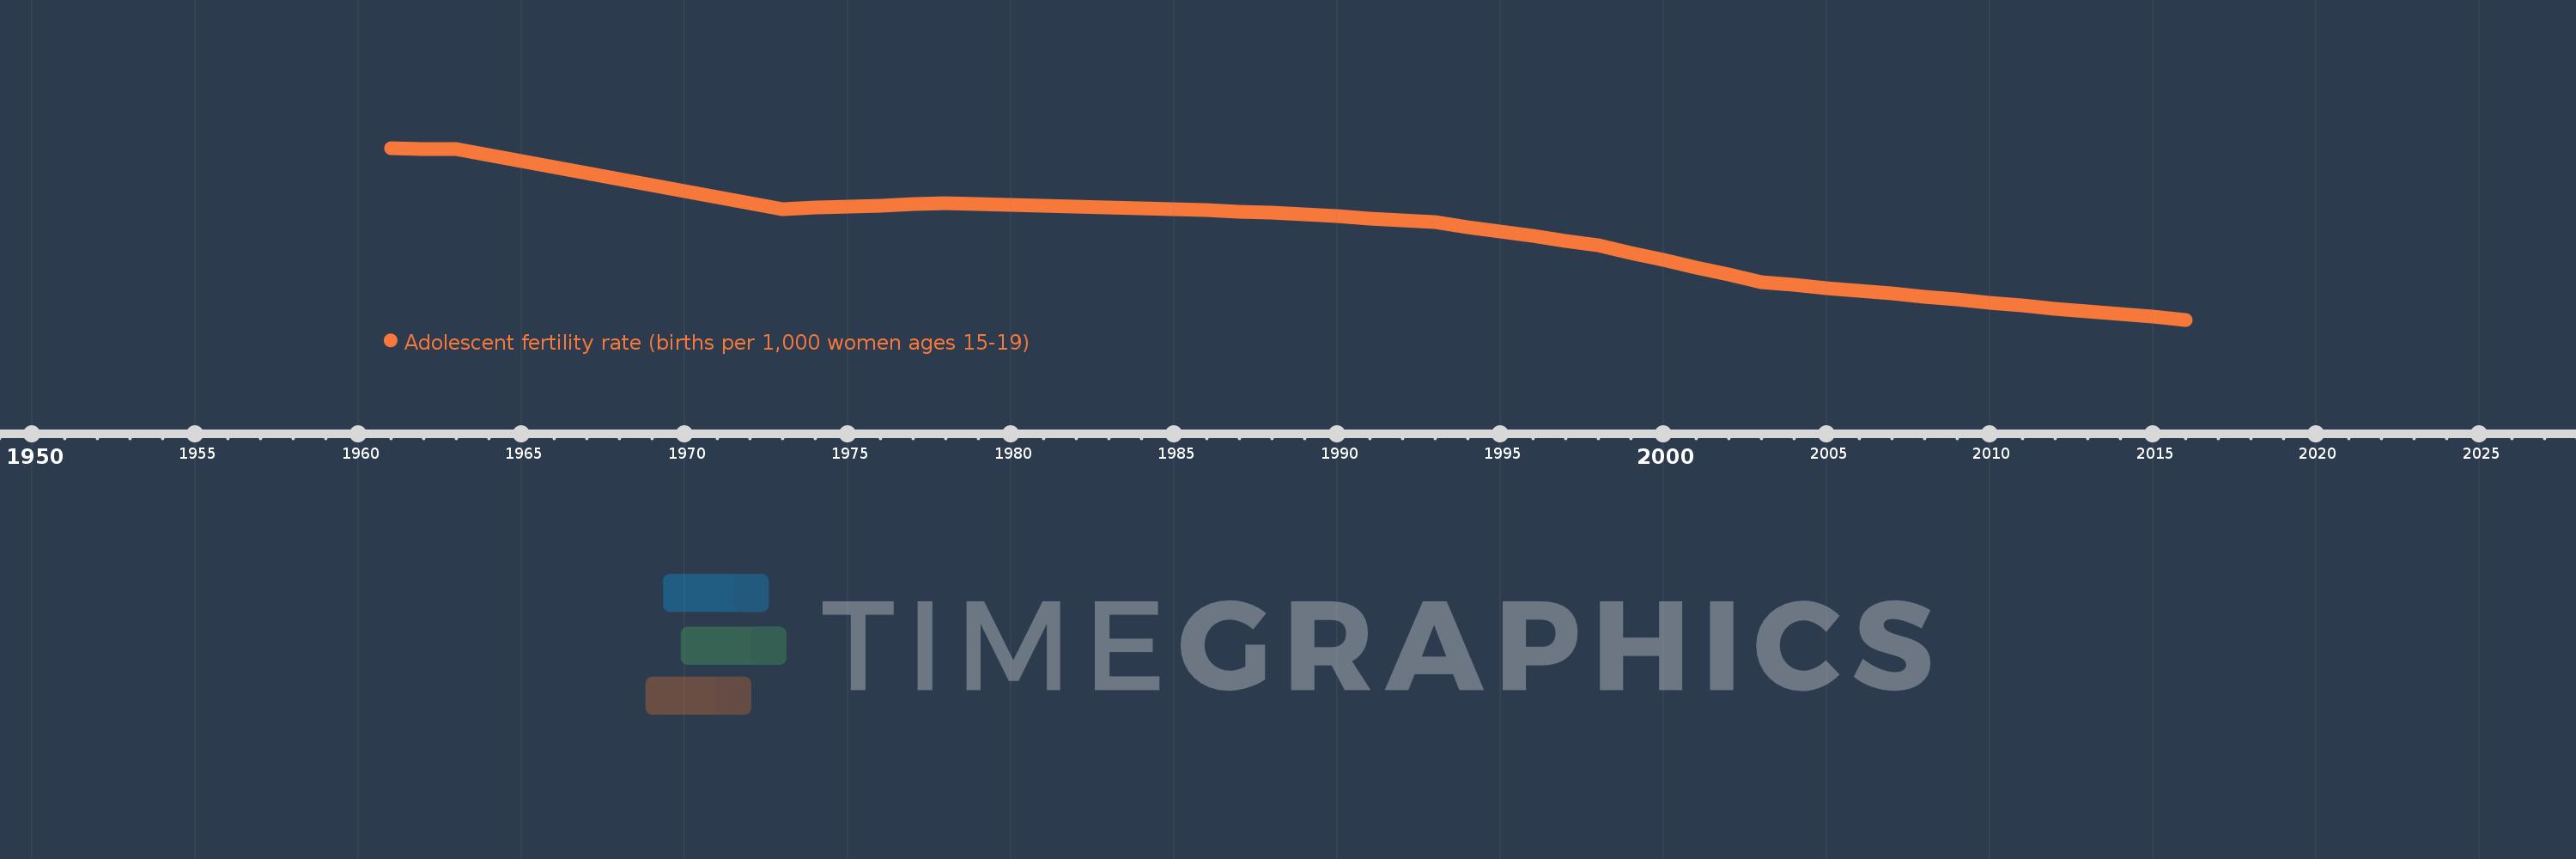
Adolescent fertility rate (births per 1,000 women ages 15-19)
2016,2015,2014,2013,2012,2011,2010,2009,2008,2007,2006,2005,2004,2003,2002,2001,2000,1999,1998,1997,1996,1995,1994,1993,1992,1991,1990,1989,1988,1987,1986,1985,1984,1983,1982,1981,1980,1979,1978,1977,1976,1975,1974,1973,1972,1971,1970,1969,1968,1967,1966,1965,1964,1963,1962,1961
This statistics in other country:
AfghanistanAlbaniaAlgeriaAngolaAntigua and BarbudaArab WorldArgentinaArmeniaArubaAustraliaAustriaAzerbaijanBahamas, TheBahrainBangladeshBarbadosBelarusBelgiumBelizeBeninBhutanBoliviaBosnia and HerzegovinaBotswanaBrazilBrunei DarussalamBulgariaBurkina FasoBurundiCabo VerdeCambodiaCameroonCanadaCaribbean small statesCentral African RepublicCentral Europe and the BalticsChadChannel IslandsChileChinaColombiaComorosCongo, Dem. Rep.Congo, Rep.Costa RicaCote d'IvoireCroatiaCubaCuracaoCyprusCzech RepublicDenmarkDjiboutiDominican RepublicEarly-demographic dividendEast Asia & PacificEast Asia & Pacific (excluding high income)East Asia & Pacific (IDA & IBRD countries)EcuadorEgypt, Arab Rep.El SalvadorEquatorial GuineaEritreaEstoniaEthiopiaEuro areaEurope & Central AsiaEurope & Central Asia (excluding high income)Europe & Central Asia (IDA & IBRD countries)European UnionFijiFinlandFragile and conflict affected situationsFranceFrench PolynesiaGabonGambia, TheGeorgiaGermanyGhanaGreeceGrenadaGuamGuatemalaGuineaGuinea-BissauGuyanaHaitiHeavily indebted poor countries (HIPC)High incomeHondurasHong Kong SAR, ChinaHungaryIBRD onlyIcelandIDA & IBRD totalIDA blendIDA onlyIDA totalIndiaIndonesiaIran, Islamic Rep.IraqIrelandIsraelItalyJamaicaJapanJordanKazakhstanKenyaKiribatiKorea, Dem. People’s Rep.Korea, Rep.KuwaitKyrgyz RepublicLao PDRLate-demographic dividendLatin America & Caribbean Latin America & Caribbean (excluding high income)Latin America & the Caribbean (IDA & IBRD countries)LatviaLeast developed countries: UN classificationLebanonLesothoLiberiaLibyaLithuaniaLow & middle incomeLow incomeLower middle incomeLuxembourgMacao SAR, ChinaMacedonia, FYRMadagascarMalawiMalaysiaMaldivesMaliMaltaMauritaniaMauritiusMexicoMicronesia, Fed. Sts.Middle East & North AfricaMiddle East & North Africa (excluding high income)Middle East & North Africa (IDA & IBRD countries)Middle incomeMoldovaMongoliaMontenegroMoroccoMozambiqueMyanmarNamibiaNepalNetherlandsNew CaledoniaNew ZealandNicaraguaNigerNigeriaNorth AmericaNorwayOECD membersOmanOther small statesPacific island small statesPakistanPanamaPapua New GuineaParaguayPeruPhilippinesPolandPortugalPost-demographic dividendPre-demographic dividendPuerto RicoQatarRomaniaRussian FederationRwandaSamoaSao Tome and PrincipeSaudi ArabiaSenegalSerbiaSeychellesSierra LeoneSingaporeSlovak RepublicSloveniaSmall statesSolomon IslandsSomaliaSouth AfricaSouth AsiaSouth Asia (IDA & IBRD)South SudanSpainSri LankaSt. LuciaSt. Vincent and the GrenadinesSub-Saharan Africa Sub-Saharan Africa (excluding high income)Sub-Saharan Africa (IDA & IBRD countries)SudanSurinameSwazilandSwedenSwitzerlandSyrian Arab RepublicTajikistanTanzaniaThailandTimor-LesteTogoTongaTrinidad and TobagoTunisiaTurkeyTurkmenistanUgandaUkraineUnited Arab EmiratesUnited KingdomUnited StatesUpper middle incomeUruguayUzbekistanVanuatuVenezuela, RBVietnamVirgin Islands (U.S.)West Bank and GazaWorldYemen, Rep.ZambiaZimbabwe Timeline:
This timeline shows a graph from 1961 to 2016 of Costa Rica. No data until 1960. Number of actual observations by date: 56.
Source name:
World Development Indicators
Source organization:
United Nations Population Division, World Population Prospects.
Categories, topics:
Health, Gender, Social Development
Last updated:
apr 23, 2017
Indicators value changes by year
Minimum:
56.026
jan 1, 2016
Maximum:
118.918
jan 1, 1961
At the date of observation
Value
Absolute change
Change from previous value
jan 1, 1961
118.918
+118.918
0.0%
jan 1, 1962
118.661
-0.257
-0.22%
jan 1, 1963
118.404
-0.257
-0.22%
jan 1, 1964
116.206
-2.198
-1.86%
jan 1, 1965
114.008
-2.198
-1.89%
jan 1, 1966
111.811
-2.198
-1.93%
jan 1, 1967
109.613
-2.198
-1.97%
jan 1, 1968
107.415
-2.198
-2.01%
jan 1, 1969
105.257
-2.158
-2.01%
jan 1, 1970
103.098
-2.158
-2.05%
jan 1, 1971
100.94
-2.158
-2.09%
jan 1, 1972
98.781
-2.158
-2.14%
jan 1, 1973
96.623
-2.158
-2.19%
jan 1, 1974
97.044
+0.421
0.44%
jan 1, 1975
97.464
+0.421
0.43%
jan 1, 1976
97.885
+0.421
0.43%
jan 1, 1977
98.305
+0.421
0.43%
jan 1, 1978
98.726
+0.421
0.43%
jan 1, 1979
98.407
-0.319
-0.32%
jan 1, 1980
98.087
-0.319
-0.32%
jan 1, 1981
97.768
-0.319
-0.33%
jan 1, 1982
97.448
-0.319
-0.33%
jan 1, 1983
97.129
-0.319
-0.33%
jan 1, 1984
96.764
-0.365
-0.38%
jan 1, 1985
96.399
-0.365
-0.38%
jan 1, 1986
96.034
-0.365
-0.38%
jan 1, 1987
95.669
-0.365
-0.38%
jan 1, 1988
95.304
-0.365
-0.38%
jan 1, 1989
94.594
-0.71
-0.75%
jan 1, 1990
93.884
-0.71
-0.75%
jan 1, 1991
93.173
-0.71
-0.76%
jan 1, 1992
92.463
-0.71
-0.76%
jan 1, 1993
91.753
-0.71
-0.77%
jan 1, 1994
90.037
-1.716
-1.87%
jan 1, 1995
88.321
-1.716
-1.91%
jan 1, 1996
86.606
-1.716
-1.94%
jan 1, 1997
84.89
-1.716
-1.98%
jan 1, 1998
83.174
-1.716
-2.02%
jan 1, 1999
80.497
-2.677
-3.22%
jan 1, 2000
77.82
-2.677
-3.33%
jan 1, 2001
75.144
-2.677
-3.44%
jan 1, 2002
72.467
-2.677
-3.56%
jan 1, 2003
69.79
-2.677
-3.69%
jan 1, 2004
68.73
-1.06
-1.52%
jan 1, 2005
67.67
-1.06
-1.54%
jan 1, 2006
66.61
-1.06
-1.57%
jan 1, 2007
65.55
-1.06
-1.59%
jan 1, 2008
64.49
-1.06
-1.62%
jan 1, 2009
63.405
-1.085
-1.68%
jan 1, 2010
62.32
-1.085
-1.71%
jan 1, 2011
61.234
-1.085
-1.74%
jan 1, 2012
60.149
-1.085
-1.77%
jan 1, 2013
59.064
-1.085
-1.8%
jan 1, 2014
58.051
-1.013
-1.71%
jan 1, 2015
57.039
-1.013
-1.74%
jan 1, 2016
56.026
-1.013
-1.78%
Ranking of countries by current statistics by years


Comments: