29
/
en
AIzaSyAYiBZKx7MnpbEhh9jyipgxe19OcubqV5w
April 1, 2024
248285
Sri Lanka
LKA
true
2
1
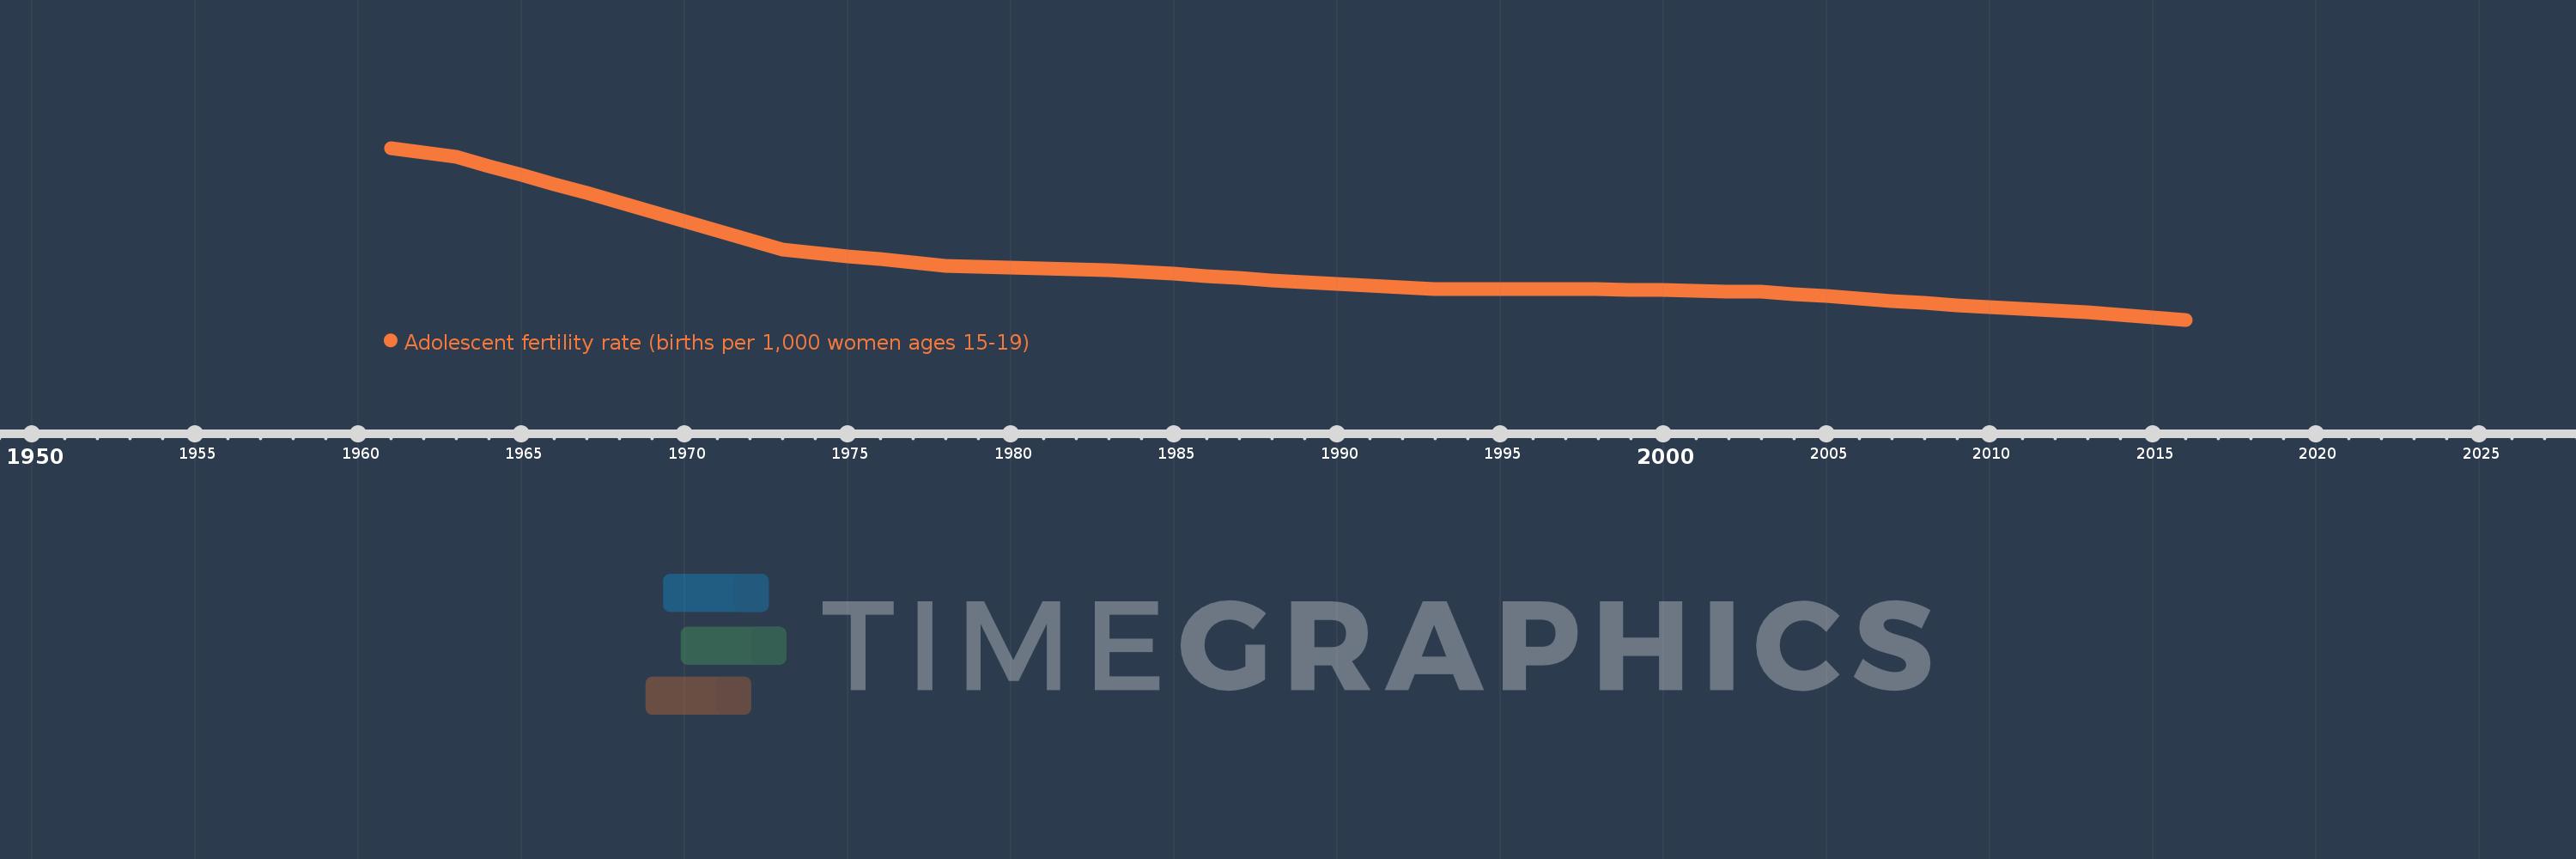
Adolescent fertility rate (births per 1,000 women ages 15-19)
2016,2015,2014,2013,2012,2011,2010,2009,2008,2007,2006,2005,2004,2003,2002,2001,2000,1999,1998,1997,1996,1995,1994,1993,1992,1991,1990,1989,1988,1987,1986,1985,1984,1983,1982,1981,1980,1979,1978,1977,1976,1975,1974,1973,1972,1971,1970,1969,1968,1967,1966,1965,1964,1963,1962,1961
This statistics in other country:
AfghanistanAlbaniaAlgeriaAngolaAntigua and BarbudaArab WorldArgentinaArmeniaArubaAustraliaAustriaAzerbaijanBahamas, TheBahrainBangladeshBarbadosBelarusBelgiumBelizeBeninBhutanBoliviaBosnia and HerzegovinaBotswanaBrazilBrunei DarussalamBulgariaBurkina FasoBurundiCabo VerdeCambodiaCameroonCanadaCaribbean small statesCentral African RepublicCentral Europe and the BalticsChadChannel IslandsChileChinaColombiaComorosCongo, Dem. Rep.Congo, Rep.Costa RicaCote d'IvoireCroatiaCubaCuracaoCyprusCzech RepublicDenmarkDjiboutiDominican RepublicEarly-demographic dividendEast Asia & PacificEast Asia & Pacific (excluding high income)East Asia & Pacific (IDA & IBRD countries)EcuadorEgypt, Arab Rep.El SalvadorEquatorial GuineaEritreaEstoniaEthiopiaEuro areaEurope & Central AsiaEurope & Central Asia (excluding high income)Europe & Central Asia (IDA & IBRD countries)European UnionFijiFinlandFragile and conflict affected situationsFranceFrench PolynesiaGabonGambia, TheGeorgiaGermanyGhanaGreeceGrenadaGuamGuatemalaGuineaGuinea-BissauGuyanaHaitiHeavily indebted poor countries (HIPC)High incomeHondurasHong Kong SAR, ChinaHungaryIBRD onlyIcelandIDA & IBRD totalIDA blendIDA onlyIDA totalIndiaIndonesiaIran, Islamic Rep.IraqIrelandIsraelItalyJamaicaJapanJordanKazakhstanKenyaKiribatiKorea, Dem. People’s Rep.Korea, Rep.KuwaitKyrgyz RepublicLao PDRLate-demographic dividendLatin America & Caribbean Latin America & Caribbean (excluding high income)Latin America & the Caribbean (IDA & IBRD countries)LatviaLeast developed countries: UN classificationLebanonLesothoLiberiaLibyaLithuaniaLow & middle incomeLow incomeLower middle incomeLuxembourgMacao SAR, ChinaMacedonia, FYRMadagascarMalawiMalaysiaMaldivesMaliMaltaMauritaniaMauritiusMexicoMicronesia, Fed. Sts.Middle East & North AfricaMiddle East & North Africa (excluding high income)Middle East & North Africa (IDA & IBRD countries)Middle incomeMoldovaMongoliaMontenegroMoroccoMozambiqueMyanmarNamibiaNepalNetherlandsNew CaledoniaNew ZealandNicaraguaNigerNigeriaNorth AmericaNorwayOECD membersOmanOther small statesPacific island small statesPakistanPanamaPapua New GuineaParaguayPeruPhilippinesPolandPortugalPost-demographic dividendPre-demographic dividendPuerto RicoQatarRomaniaRussian FederationRwandaSamoaSao Tome and PrincipeSaudi ArabiaSenegalSerbiaSeychellesSierra LeoneSingaporeSlovak RepublicSloveniaSmall statesSolomon IslandsSomaliaSouth AfricaSouth AsiaSouth Asia (IDA & IBRD)South SudanSpainSri LankaSt. LuciaSt. Vincent and the GrenadinesSub-Saharan Africa Sub-Saharan Africa (excluding high income)Sub-Saharan Africa (IDA & IBRD countries)SudanSurinameSwazilandSwedenSwitzerlandSyrian Arab RepublicTajikistanTanzaniaThailandTimor-LesteTogoTongaTrinidad and TobagoTunisiaTurkeyTurkmenistanUgandaUkraineUnited Arab EmiratesUnited KingdomUnited StatesUpper middle incomeUruguayUzbekistanVanuatuVenezuela, RBVietnamVirgin Islands (U.S.)West Bank and GazaWorldYemen, Rep.ZambiaZimbabwe Timeline:
This timeline shows a graph from 1961 to 2016 of Sri Lanka. No data until 1960. Number of actual observations by date: 56.
Source name:
World Development Indicators
Source organization:
United Nations Population Division, World Population Prospects.
Categories, topics:
Health, Gender, Social Development
Last updated:
apr 23, 2017
Indicators value changes by year
Minimum:
14.153
jan 1, 2016
Maximum:
98.642
jan 1, 1961
At the date of observation
Value
Absolute change
Change from previous value
jan 1, 1961
98.642
+98.642
0.0%
jan 1, 1962
96.386
-2.256
-2.29%
jan 1, 1963
94.13
-2.256
-2.34%
jan 1, 1964
89.723
-4.407
-4.68%
jan 1, 1965
85.317
-4.407
-4.91%
jan 1, 1966
80.91
-4.407
-5.16%
jan 1, 1967
76.504
-4.407
-5.45%
jan 1, 1968
72.097
-4.407
-5.76%
jan 1, 1969
67.401
-4.696
-6.51%
jan 1, 1970
62.705
-4.696
-6.97%
jan 1, 1971
58.008
-4.696
-7.49%
jan 1, 1972
53.312
-4.696
-8.1%
jan 1, 1973
48.616
-4.696
-8.81%
jan 1, 1974
47.055
-1.561
-3.21%
jan 1, 1975
45.494
-1.561
-3.32%
jan 1, 1976
43.932
-1.561
-3.43%
jan 1, 1977
42.371
-1.561
-3.55%
jan 1, 1978
40.81
-1.561
-3.68%
jan 1, 1979
40.396
-0.414
-1.02%
jan 1, 1980
39.981
-0.414
-1.03%
jan 1, 1981
39.567
-0.414
-1.04%
jan 1, 1982
39.152
-0.414
-1.05%
jan 1, 1983
38.738
-0.414
-1.06%
jan 1, 1984
37.695
-1.043
-2.69%
jan 1, 1985
36.651
-1.043
-2.77%
jan 1, 1986
35.608
-1.043
-2.85%
jan 1, 1987
34.564
-1.043
-2.93%
jan 1, 1988
33.521
-1.043
-3.02%
jan 1, 1989
32.675
-0.846
-2.52%
jan 1, 1990
31.83
-0.846
-2.59%
jan 1, 1991
30.984
-0.846
-2.66%
jan 1, 1992
30.139
-0.846
-2.73%
jan 1, 1993
29.293
-0.846
-2.81%
jan 1, 1994
29.266
-0.027
-0.09%
jan 1, 1995
29.24
-0.027
-0.09%
jan 1, 1996
29.213
-0.027
-0.09%
jan 1, 1997
29.187
-0.027
-0.09%
jan 1, 1998
29.16
-0.027
-0.09%
jan 1, 1999
28.909
-0.251
-0.86%
jan 1, 2000
28.658
-0.251
-0.87%
jan 1, 2001
28.406
-0.251
-0.88%
jan 1, 2002
28.155
-0.251
-0.88%
jan 1, 2003
27.904
-0.251
-0.89%
jan 1, 2004
26.781
-1.123
-4.02%
jan 1, 2005
25.658
-1.123
-4.19%
jan 1, 2006
24.535
-1.123
-4.38%
jan 1, 2007
23.412
-1.123
-4.58%
jan 1, 2008
22.289
-1.123
-4.8%
jan 1, 2009
21.387
-0.902
-4.05%
jan 1, 2010
20.484
-0.902
-4.22%
jan 1, 2011
19.582
-0.902
-4.41%
jan 1, 2012
18.679
-0.902
-4.61%
jan 1, 2013
17.777
-0.902
-4.83%
jan 1, 2014
16.569
-1.208
-6.8%
jan 1, 2015
15.361
-1.208
-7.29%
jan 1, 2016
14.153
-1.208
-7.86%
Ranking of countries by current statistics by years


Comments: