29
/
en
AIzaSyAYiBZKx7MnpbEhh9jyipgxe19OcubqV5w
April 1, 2024
127988
Eritrea
ERI
true
2
1
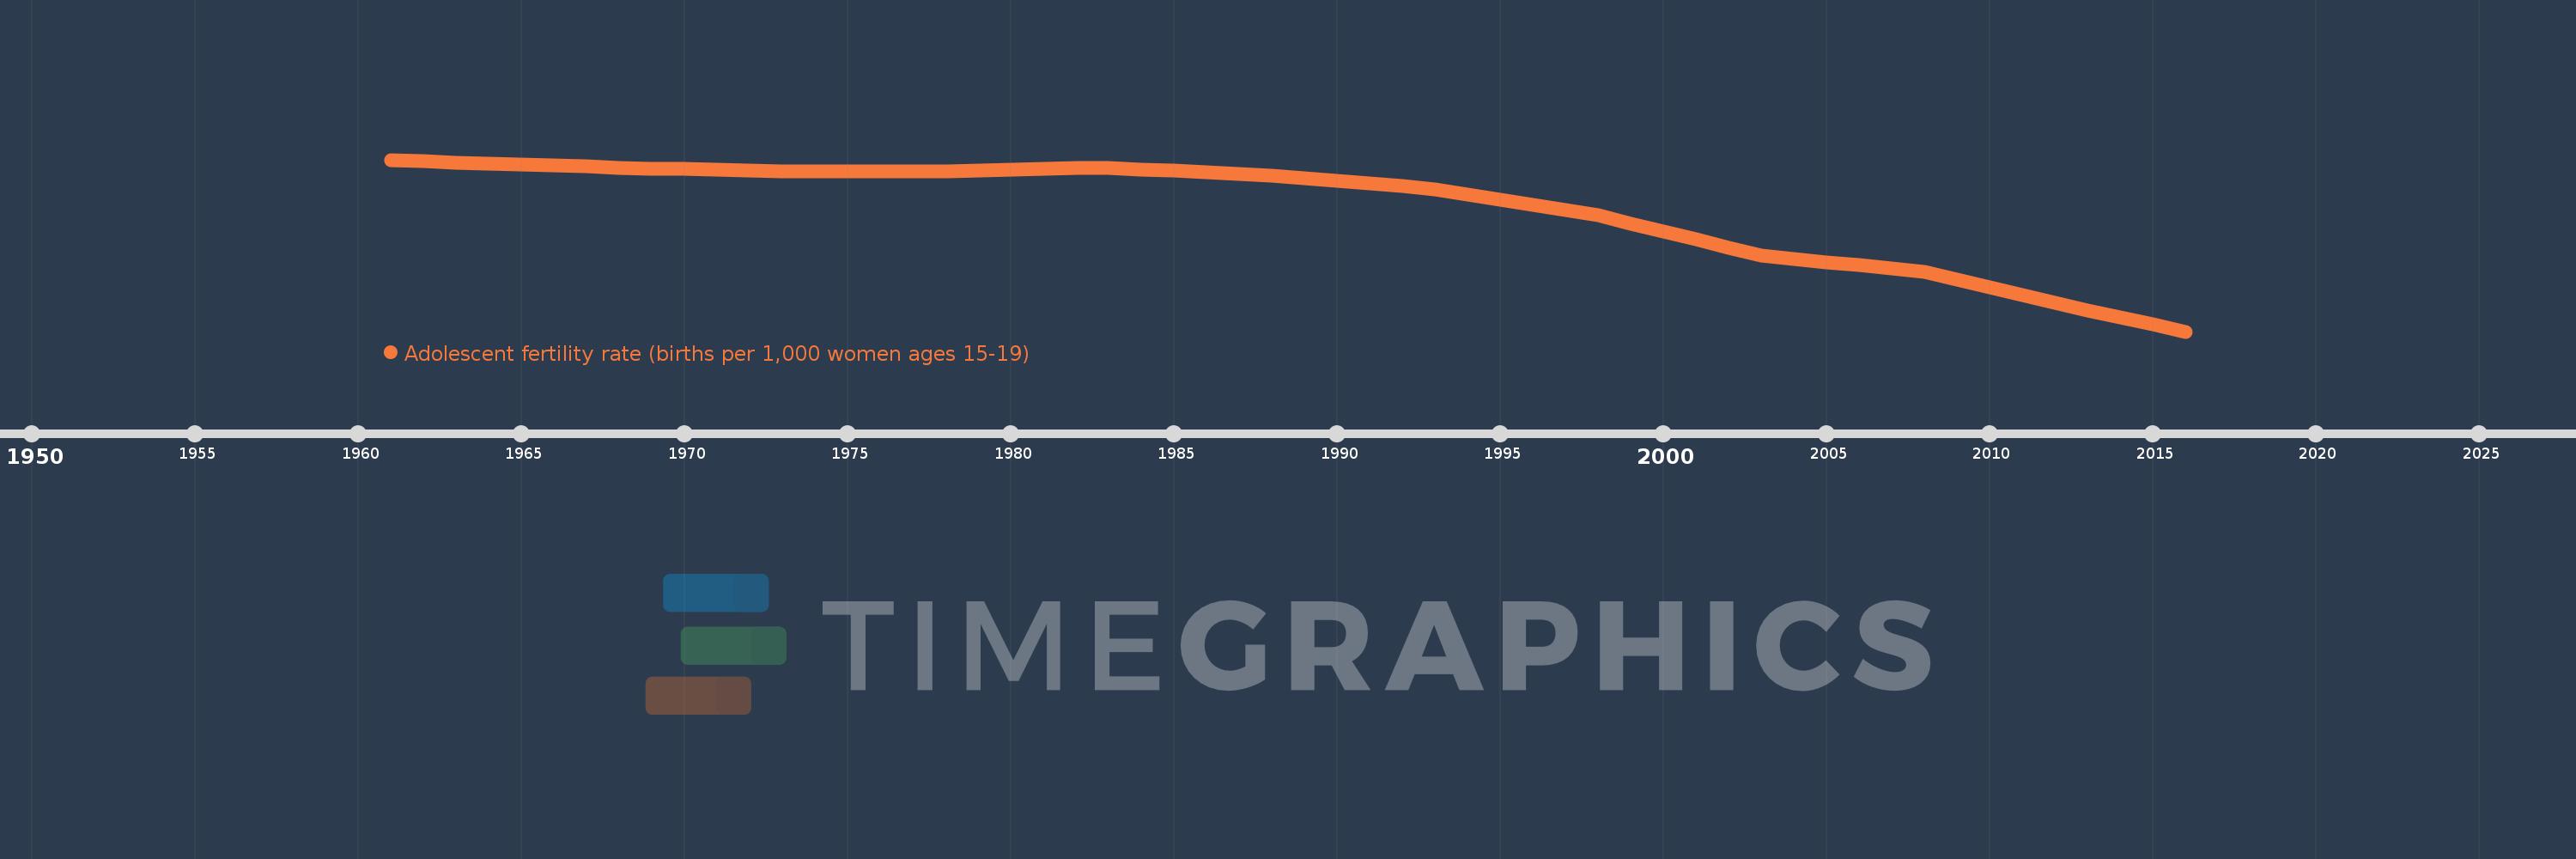
Adolescent fertility rate (births per 1,000 women ages 15-19)
2016,2015,2014,2013,2012,2011,2010,2009,2008,2007,2006,2005,2004,2003,2002,2001,2000,1999,1998,1997,1996,1995,1994,1993,1992,1991,1990,1989,1988,1987,1986,1985,1984,1983,1982,1981,1980,1979,1978,1977,1976,1975,1974,1973,1972,1971,1970,1969,1968,1967,1966,1965,1964,1963,1962,1961
This statistics in other country:
AfghanistanAlbaniaAlgeriaAngolaAntigua and BarbudaArab WorldArgentinaArmeniaArubaAustraliaAustriaAzerbaijanBahamas, TheBahrainBangladeshBarbadosBelarusBelgiumBelizeBeninBhutanBoliviaBosnia and HerzegovinaBotswanaBrazilBrunei DarussalamBulgariaBurkina FasoBurundiCabo VerdeCambodiaCameroonCanadaCaribbean small statesCentral African RepublicCentral Europe and the BalticsChadChannel IslandsChileChinaColombiaComorosCongo, Dem. Rep.Congo, Rep.Costa RicaCote d'IvoireCroatiaCubaCuracaoCyprusCzech RepublicDenmarkDjiboutiDominican RepublicEarly-demographic dividendEast Asia & PacificEast Asia & Pacific (excluding high income)East Asia & Pacific (IDA & IBRD countries)EcuadorEgypt, Arab Rep.El SalvadorEquatorial GuineaEritreaEstoniaEthiopiaEuro areaEurope & Central AsiaEurope & Central Asia (excluding high income)Europe & Central Asia (IDA & IBRD countries)European UnionFijiFinlandFragile and conflict affected situationsFranceFrench PolynesiaGabonGambia, TheGeorgiaGermanyGhanaGreeceGrenadaGuamGuatemalaGuineaGuinea-BissauGuyanaHaitiHeavily indebted poor countries (HIPC)High incomeHondurasHong Kong SAR, ChinaHungaryIBRD onlyIcelandIDA & IBRD totalIDA blendIDA onlyIDA totalIndiaIndonesiaIran, Islamic Rep.IraqIrelandIsraelItalyJamaicaJapanJordanKazakhstanKenyaKiribatiKorea, Dem. People’s Rep.Korea, Rep.KuwaitKyrgyz RepublicLao PDRLate-demographic dividendLatin America & Caribbean Latin America & Caribbean (excluding high income)Latin America & the Caribbean (IDA & IBRD countries)LatviaLeast developed countries: UN classificationLebanonLesothoLiberiaLibyaLithuaniaLow & middle incomeLow incomeLower middle incomeLuxembourgMacao SAR, ChinaMacedonia, FYRMadagascarMalawiMalaysiaMaldivesMaliMaltaMauritaniaMauritiusMexicoMicronesia, Fed. Sts.Middle East & North AfricaMiddle East & North Africa (excluding high income)Middle East & North Africa (IDA & IBRD countries)Middle incomeMoldovaMongoliaMontenegroMoroccoMozambiqueMyanmarNamibiaNepalNetherlandsNew CaledoniaNew ZealandNicaraguaNigerNigeriaNorth AmericaNorwayOECD membersOmanOther small statesPacific island small statesPakistanPanamaPapua New GuineaParaguayPeruPhilippinesPolandPortugalPost-demographic dividendPre-demographic dividendPuerto RicoQatarRomaniaRussian FederationRwandaSamoaSao Tome and PrincipeSaudi ArabiaSenegalSerbiaSeychellesSierra LeoneSingaporeSlovak RepublicSloveniaSmall statesSolomon IslandsSomaliaSouth AfricaSouth AsiaSouth Asia (IDA & IBRD)South SudanSpainSri LankaSt. LuciaSt. Vincent and the GrenadinesSub-Saharan Africa Sub-Saharan Africa (excluding high income)Sub-Saharan Africa (IDA & IBRD countries)SudanSurinameSwazilandSwedenSwitzerlandSyrian Arab RepublicTajikistanTanzaniaThailandTimor-LesteTogoTongaTrinidad and TobagoTunisiaTurkeyTurkmenistanUgandaUkraineUnited Arab EmiratesUnited KingdomUnited StatesUpper middle incomeUruguayUzbekistanVanuatuVenezuela, RBVietnamVirgin Islands (U.S.)West Bank and GazaWorldYemen, Rep.ZambiaZimbabwe Timeline:
This timeline shows a graph from 1961 to 2016 of Eritrea. No data until 1960. Number of actual observations by date: 56.
Source name:
World Development Indicators
Source organization:
United Nations Population Division, World Population Prospects.
Categories, topics:
Health, Gender, Social Development
Last updated:
apr 23, 2017
Indicators value changes by year
Minimum:
53.002
jan 1, 2016
Maximum:
119.488
jan 1, 1961
At the date of observation
Value
Absolute change
Change from previous value
jan 1, 1961
119.488
+119.488
0.0%
jan 1, 1962
118.966
-0.521
-0.44%
jan 1, 1963
118.445
-0.521
-0.44%
jan 1, 1964
118.042
-0.403
-0.34%
jan 1, 1965
117.639
-0.403
-0.34%
jan 1, 1966
117.235
-0.403
-0.34%
jan 1, 1967
116.832
-0.403
-0.34%
jan 1, 1968
116.429
-0.403
-0.35%
jan 1, 1969
116.154
-0.275
-0.24%
jan 1, 1970
115.88
-0.275
-0.24%
jan 1, 1971
115.605
-0.275
-0.24%
jan 1, 1972
115.331
-0.275
-0.24%
jan 1, 1973
115.056
-0.275
-0.24%
jan 1, 1974
115.056
0.0
0.0%
jan 1, 1975
115.056
0.0
0.0%
jan 1, 1976
115.056
0.0
0.0%
jan 1, 1977
115.056
0.0
0.0%
jan 1, 1978
115.056
0.0
0.0%
jan 1, 1979
115.334
+0.278
0.24%
jan 1, 1980
115.612
+0.278
0.24%
jan 1, 1981
115.89
+0.278
0.24%
jan 1, 1982
116.168
+0.278
0.24%
jan 1, 1983
116.446
+0.278
0.24%
jan 1, 1984
115.83
-0.616
-0.53%
jan 1, 1985
115.213
-0.616
-0.53%
jan 1, 1986
114.597
-0.616
-0.54%
jan 1, 1987
113.98
-0.616
-0.54%
jan 1, 1988
113.364
-0.616
-0.54%
jan 1, 1989
112.327
-1.037
-0.91%
jan 1, 1990
111.29
-1.037
-0.92%
jan 1, 1991
110.252
-1.037
-0.93%
jan 1, 1992
109.215
-1.037
-0.94%
jan 1, 1993
108.178
-1.037
-0.95%
jan 1, 1994
106.124
-2.054
-1.9%
jan 1, 1995
104.071
-2.054
-1.94%
jan 1, 1996
102.017
-2.054
-1.97%
jan 1, 1997
99.964
-2.054
-2.01%
jan 1, 1998
97.91
-2.054
-2.05%
jan 1, 1999
94.805
-3.105
-3.17%
jan 1, 2000
91.7
-3.105
-3.28%
jan 1, 2001
88.595
-3.105
-3.39%
jan 1, 2002
85.49
-3.105
-3.5%
jan 1, 2003
82.385
-3.105
-3.63%
jan 1, 2004
81.124
-1.261
-1.53%
jan 1, 2005
79.863
-1.261
-1.55%
jan 1, 2006
78.601
-1.261
-1.58%
jan 1, 2007
77.34
-1.261
-1.6%
jan 1, 2008
76.079
-1.261
-1.63%
jan 1, 2009
73.065
-3.014
-3.96%
jan 1, 2010
70.051
-3.014
-4.12%
jan 1, 2011
67.038
-3.014
-4.3%
jan 1, 2012
64.024
-3.014
-4.5%
jan 1, 2013
61.01
-3.014
-4.71%
jan 1, 2014
58.341
-2.669
-4.38%
jan 1, 2015
55.671
-2.669
-4.58%
jan 1, 2016
53.002
-2.669
-4.79%
Ranking of countries by current statistics by years


Comments: