29
/
en
AIzaSyAYiBZKx7MnpbEhh9jyipgxe19OcubqV5w
April 1, 2024
80158
Belarus
BLR
true
2
1
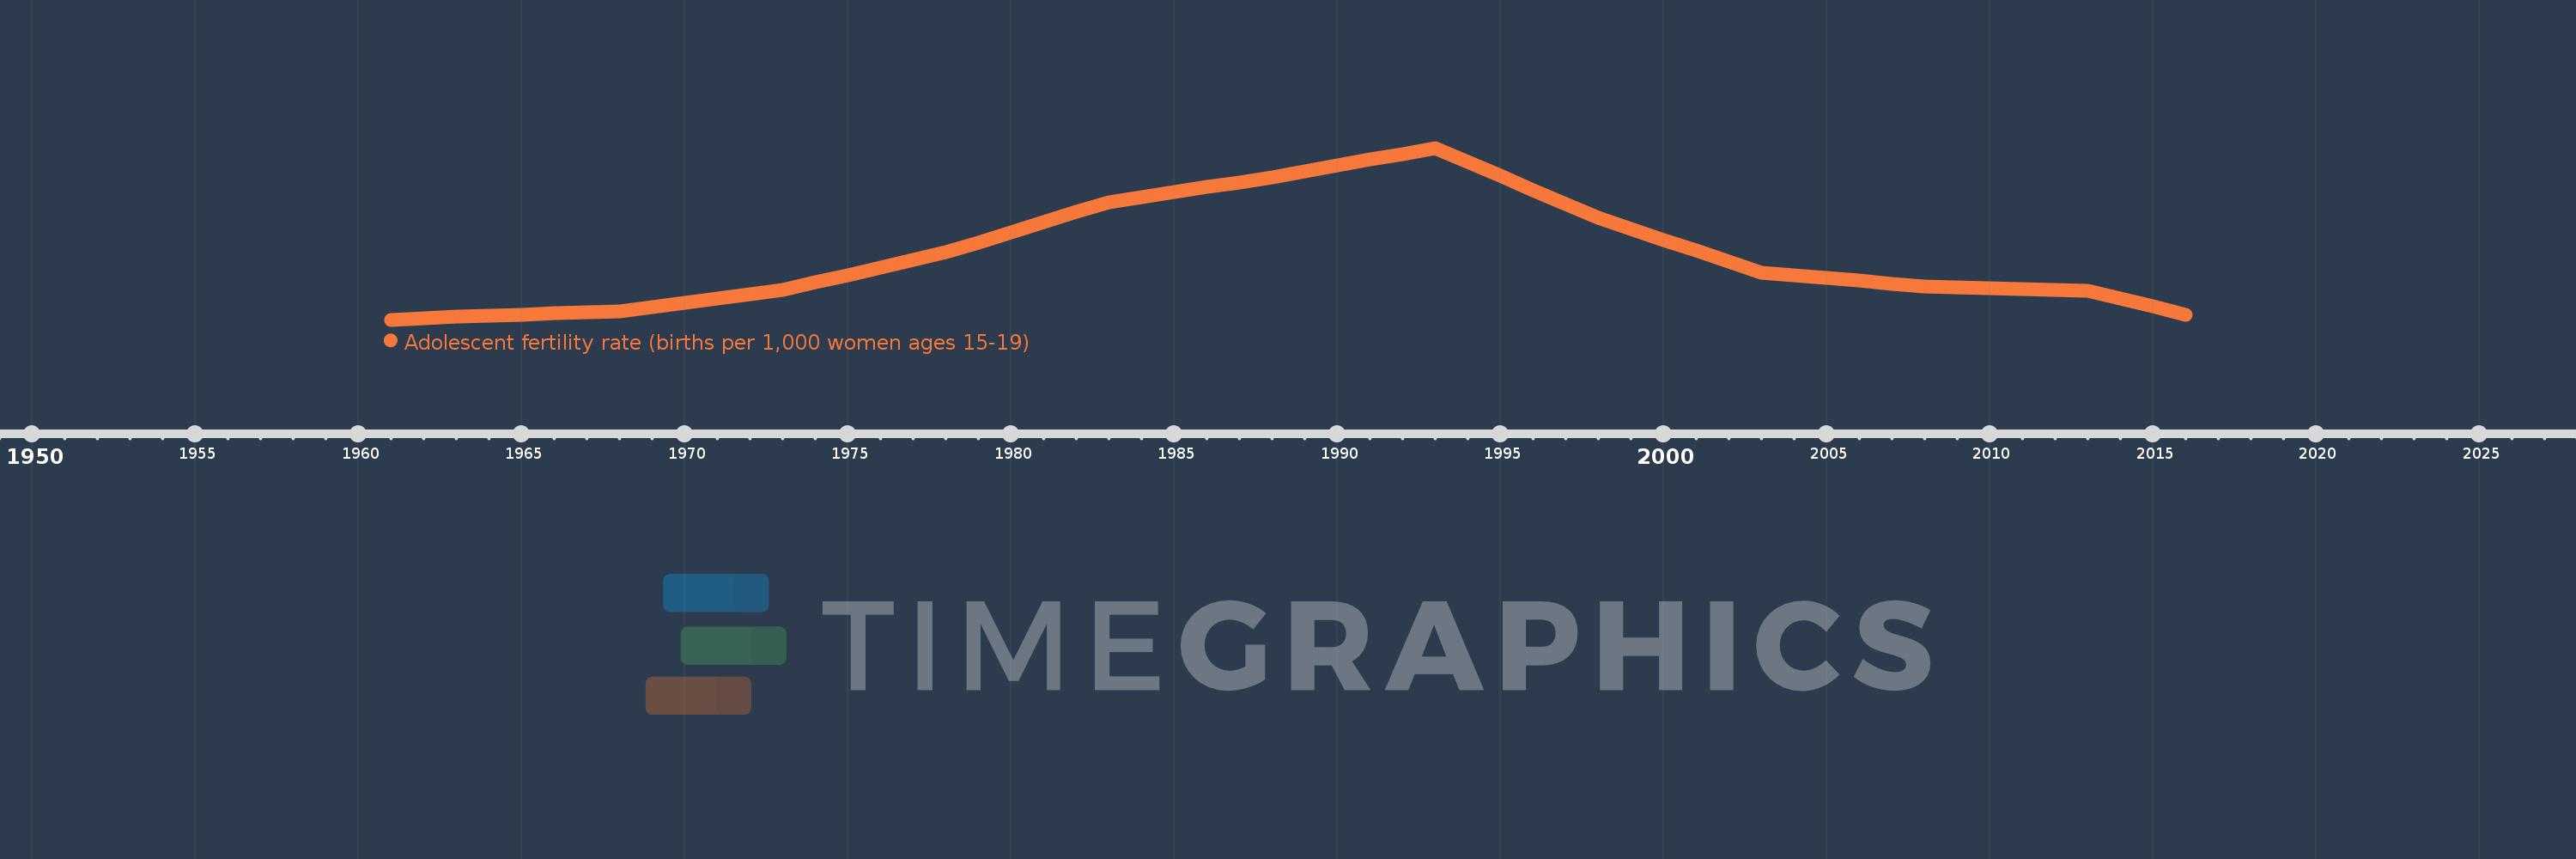
Adolescent fertility rate (births per 1,000 women ages 15-19)
2016,2015,2014,2013,2012,2011,2010,2009,2008,2007,2006,2005,2004,2003,2002,2001,2000,1999,1998,1997,1996,1995,1994,1993,1992,1991,1990,1989,1988,1987,1986,1985,1984,1983,1982,1981,1980,1979,1978,1977,1976,1975,1974,1973,1972,1971,1970,1969,1968,1967,1966,1965,1964,1963,1962,1961
This statistics in other country:
AfghanistanAlbaniaAlgeriaAngolaAntigua and BarbudaArab WorldArgentinaArmeniaArubaAustraliaAustriaAzerbaijanBahamas, TheBahrainBangladeshBarbadosBelarusBelgiumBelizeBeninBhutanBoliviaBosnia and HerzegovinaBotswanaBrazilBrunei DarussalamBulgariaBurkina FasoBurundiCabo VerdeCambodiaCameroonCanadaCaribbean small statesCentral African RepublicCentral Europe and the BalticsChadChannel IslandsChileChinaColombiaComorosCongo, Dem. Rep.Congo, Rep.Costa RicaCote d'IvoireCroatiaCubaCuracaoCyprusCzech RepublicDenmarkDjiboutiDominican RepublicEarly-demographic dividendEast Asia & PacificEast Asia & Pacific (excluding high income)East Asia & Pacific (IDA & IBRD countries)EcuadorEgypt, Arab Rep.El SalvadorEquatorial GuineaEritreaEstoniaEthiopiaEuro areaEurope & Central AsiaEurope & Central Asia (excluding high income)Europe & Central Asia (IDA & IBRD countries)European UnionFijiFinlandFragile and conflict affected situationsFranceFrench PolynesiaGabonGambia, TheGeorgiaGermanyGhanaGreeceGrenadaGuamGuatemalaGuineaGuinea-BissauGuyanaHaitiHeavily indebted poor countries (HIPC)High incomeHondurasHong Kong SAR, ChinaHungaryIBRD onlyIcelandIDA & IBRD totalIDA blendIDA onlyIDA totalIndiaIndonesiaIran, Islamic Rep.IraqIrelandIsraelItalyJamaicaJapanJordanKazakhstanKenyaKiribatiKorea, Dem. People’s Rep.Korea, Rep.KuwaitKyrgyz RepublicLao PDRLate-demographic dividendLatin America & Caribbean Latin America & Caribbean (excluding high income)Latin America & the Caribbean (IDA & IBRD countries)LatviaLeast developed countries: UN classificationLebanonLesothoLiberiaLibyaLithuaniaLow & middle incomeLow incomeLower middle incomeLuxembourgMacao SAR, ChinaMacedonia, FYRMadagascarMalawiMalaysiaMaldivesMaliMaltaMauritaniaMauritiusMexicoMicronesia, Fed. Sts.Middle East & North AfricaMiddle East & North Africa (excluding high income)Middle East & North Africa (IDA & IBRD countries)Middle incomeMoldovaMongoliaMontenegroMoroccoMozambiqueMyanmarNamibiaNepalNetherlandsNew CaledoniaNew ZealandNicaraguaNigerNigeriaNorth AmericaNorwayOECD membersOmanOther small statesPacific island small statesPakistanPanamaPapua New GuineaParaguayPeruPhilippinesPolandPortugalPost-demographic dividendPre-demographic dividendPuerto RicoQatarRomaniaRussian FederationRwandaSamoaSao Tome and PrincipeSaudi ArabiaSenegalSerbiaSeychellesSierra LeoneSingaporeSlovak RepublicSloveniaSmall statesSolomon IslandsSomaliaSouth AfricaSouth AsiaSouth Asia (IDA & IBRD)South SudanSpainSri LankaSt. LuciaSt. Vincent and the GrenadinesSub-Saharan Africa Sub-Saharan Africa (excluding high income)Sub-Saharan Africa (IDA & IBRD countries)SudanSurinameSwazilandSwedenSwitzerlandSyrian Arab RepublicTajikistanTanzaniaThailandTimor-LesteTogoTongaTrinidad and TobagoTunisiaTurkeyTurkmenistanUgandaUkraineUnited Arab EmiratesUnited KingdomUnited StatesUpper middle incomeUruguayUzbekistanVanuatuVenezuela, RBVietnamVirgin Islands (U.S.)West Bank and GazaWorldYemen, Rep.ZambiaZimbabwe Timeline:
This timeline shows a graph from 1961 to 2016 of Belarus. No data until 1960. Number of actual observations by date: 56.
Source name:
World Development Indicators
Source organization:
United Nations Population Division, World Population Prospects.
Categories, topics:
Health, Gender, Social Development
Last updated:
apr 23, 2017
Indicators value changes by year
Minimum:
16.727
jan 1, 1961
Maximum:
44.236
jan 1, 1993
At the date of observation
Value
Absolute change
Change from previous value
jan 1, 1961
16.727
+16.727
0.0%
jan 1, 1962
16.974
+0.247
1.48%
jan 1, 1963
17.221
+0.247
1.45%
jan 1, 1964
17.392
+0.171
0.99%
jan 1, 1965
17.562
+0.171
0.98%
jan 1, 1966
17.733
+0.171
0.97%
jan 1, 1967
17.903
+0.171
0.96%
jan 1, 1968
18.074
+0.171
0.95%
jan 1, 1969
18.758
+0.684
3.78%
jan 1, 1970
19.441
+0.684
3.64%
jan 1, 1971
20.125
+0.684
3.52%
jan 1, 1972
20.808
+0.684
3.4%
jan 1, 1973
21.492
+0.684
3.29%
jan 1, 1974
22.692
+1.2
5.58%
jan 1, 1975
23.892
+1.2
5.29%
jan 1, 1976
25.092
+1.2
5.02%
jan 1, 1977
26.292
+1.2
4.78%
jan 1, 1978
27.492
+1.2
4.56%
jan 1, 1979
29.112
+1.62
5.89%
jan 1, 1980
30.732
+1.62
5.56%
jan 1, 1981
32.352
+1.62
5.27%
jan 1, 1982
33.972
+1.62
5.01%
jan 1, 1983
35.592
+1.62
4.77%
jan 1, 1984
36.384
+0.792
2.22%
jan 1, 1985
37.176
+0.792
2.18%
jan 1, 1986
37.967
+0.792
2.13%
jan 1, 1987
38.759
+0.792
2.09%
jan 1, 1988
39.551
+0.792
2.04%
jan 1, 1989
40.488
+0.937
2.37%
jan 1, 1990
41.425
+0.937
2.31%
jan 1, 1991
42.362
+0.937
2.26%
jan 1, 1992
43.299
+0.937
2.21%
jan 1, 1993
44.236
+0.937
2.16%
jan 1, 1994
41.993
-2.243
-5.07%
jan 1, 1995
39.75
-2.243
-5.34%
jan 1, 1996
37.507
-2.243
-5.64%
jan 1, 1997
35.264
-2.243
-5.98%
jan 1, 1998
33.021
-2.243
-6.36%
jan 1, 1999
31.275
-1.746
-5.29%
jan 1, 2000
29.529
-1.746
-5.58%
jan 1, 2001
27.783
-1.746
-5.91%
jan 1, 2002
26.037
-1.746
-6.28%
jan 1, 2003
24.291
-1.746
-6.71%
jan 1, 2004
23.848
-0.443
-1.82%
jan 1, 2005
23.405
-0.443
-1.86%
jan 1, 2006
22.961
-0.443
-1.89%
jan 1, 2007
22.518
-0.443
-1.93%
jan 1, 2008
22.075
-0.443
-1.97%
jan 1, 2009
21.944
-0.131
-0.6%
jan 1, 2010
21.812
-0.131
-0.6%
jan 1, 2011
21.681
-0.131
-0.6%
jan 1, 2012
21.549
-0.131
-0.61%
jan 1, 2013
21.418
-0.131
-0.61%
jan 1, 2014
20.129
-1.289
-6.02%
jan 1, 2015
18.84
-1.289
-6.4%
jan 1, 2016
17.551
-1.289
-6.84%
Ranking of countries by current statistics by years


Comments: