29
/
en
AIzaSyAYiBZKx7MnpbEhh9jyipgxe19OcubqV5w
April 1, 2024
201196
Morocco
MAR
true
2
1
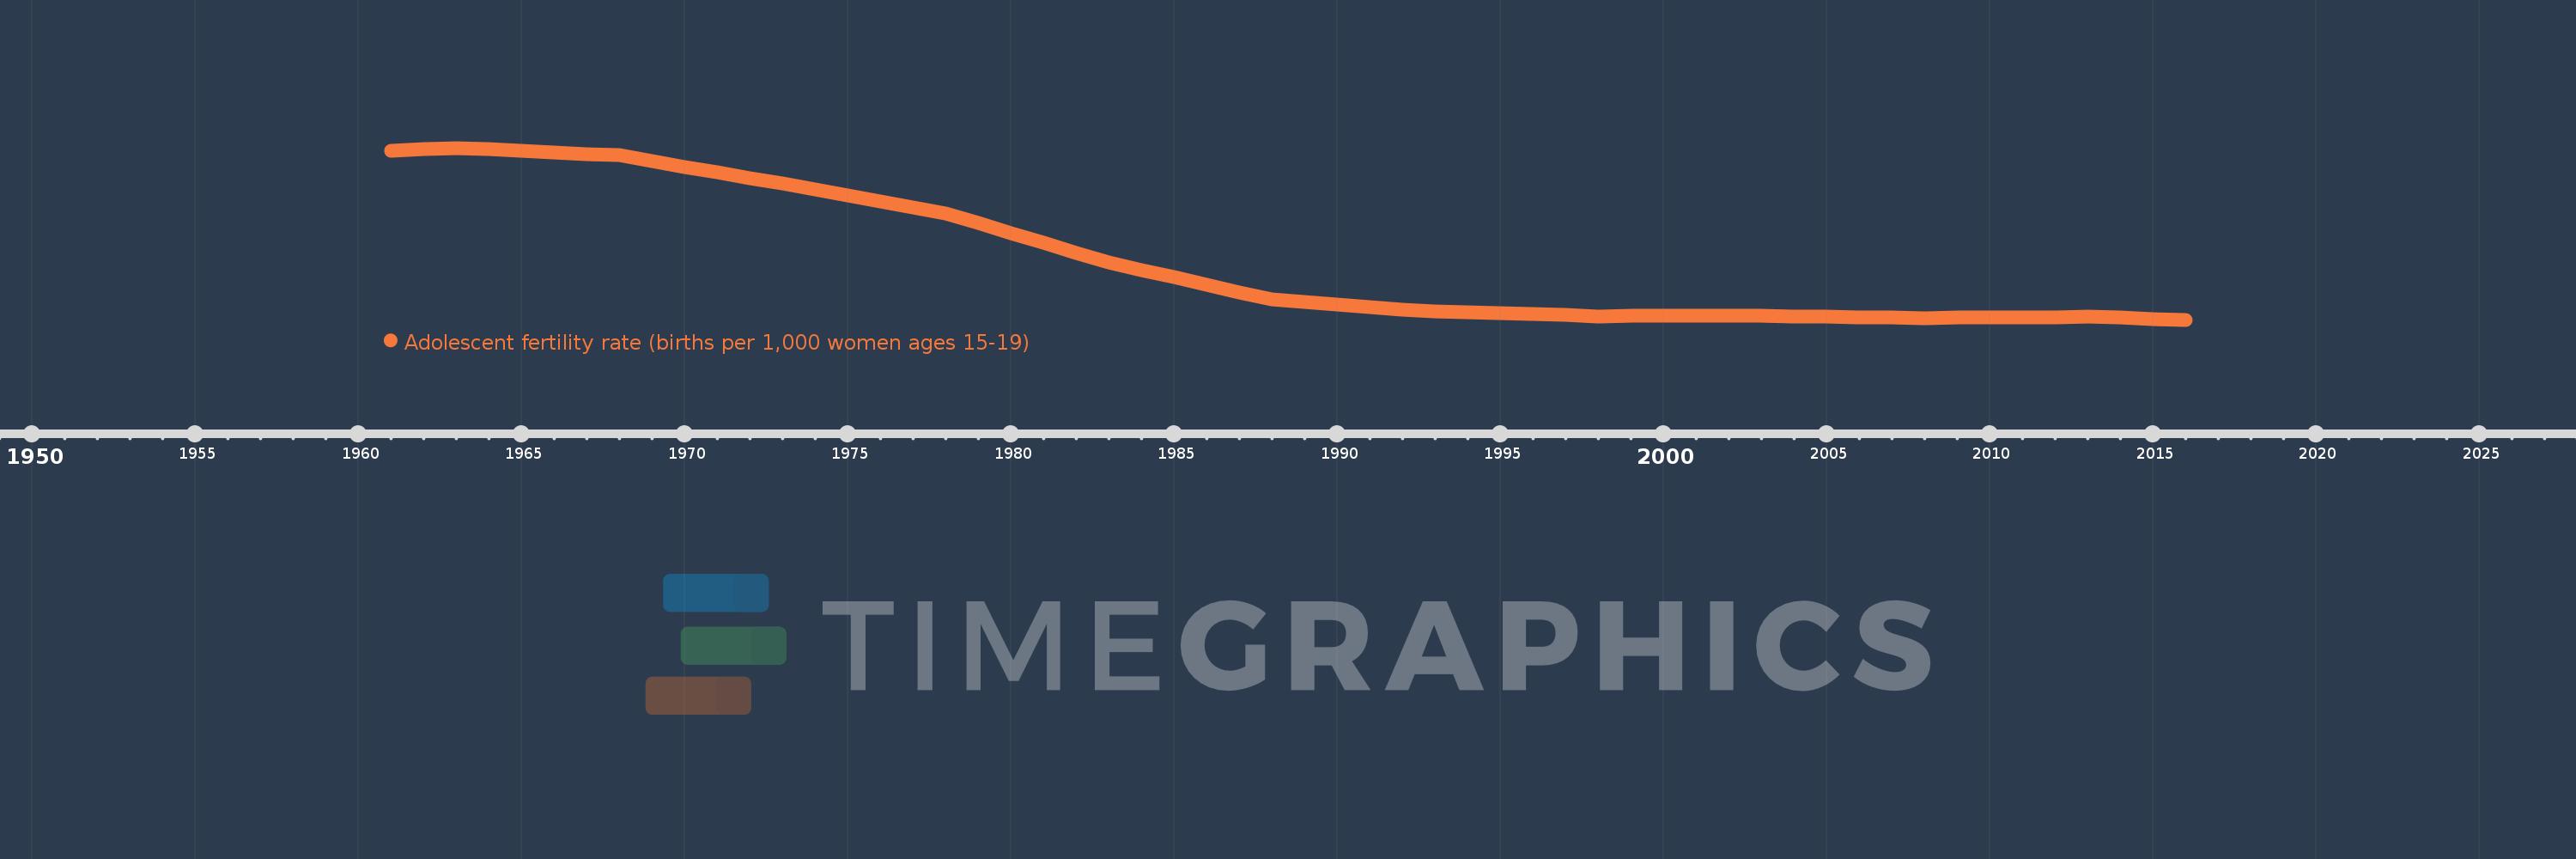
Adolescent fertility rate (births per 1,000 women ages 15-19)
2016,2015,2014,2013,2012,2011,2010,2009,2008,2007,2006,2005,2004,2003,2002,2001,2000,1999,1998,1997,1996,1995,1994,1993,1992,1991,1990,1989,1988,1987,1986,1985,1984,1983,1982,1981,1980,1979,1978,1977,1976,1975,1974,1973,1972,1971,1970,1969,1968,1967,1966,1965,1964,1963,1962,1961
This statistics in other country:
AfghanistanAlbaniaAlgeriaAngolaAntigua and BarbudaArab WorldArgentinaArmeniaArubaAustraliaAustriaAzerbaijanBahamas, TheBahrainBangladeshBarbadosBelarusBelgiumBelizeBeninBhutanBoliviaBosnia and HerzegovinaBotswanaBrazilBrunei DarussalamBulgariaBurkina FasoBurundiCabo VerdeCambodiaCameroonCanadaCaribbean small statesCentral African RepublicCentral Europe and the BalticsChadChannel IslandsChileChinaColombiaComorosCongo, Dem. Rep.Congo, Rep.Costa RicaCote d'IvoireCroatiaCubaCuracaoCyprusCzech RepublicDenmarkDjiboutiDominican RepublicEarly-demographic dividendEast Asia & PacificEast Asia & Pacific (excluding high income)East Asia & Pacific (IDA & IBRD countries)EcuadorEgypt, Arab Rep.El SalvadorEquatorial GuineaEritreaEstoniaEthiopiaEuro areaEurope & Central AsiaEurope & Central Asia (excluding high income)Europe & Central Asia (IDA & IBRD countries)European UnionFijiFinlandFragile and conflict affected situationsFranceFrench PolynesiaGabonGambia, TheGeorgiaGermanyGhanaGreeceGrenadaGuamGuatemalaGuineaGuinea-BissauGuyanaHaitiHeavily indebted poor countries (HIPC)High incomeHondurasHong Kong SAR, ChinaHungaryIBRD onlyIcelandIDA & IBRD totalIDA blendIDA onlyIDA totalIndiaIndonesiaIran, Islamic Rep.IraqIrelandIsraelItalyJamaicaJapanJordanKazakhstanKenyaKiribatiKorea, Dem. People’s Rep.Korea, Rep.KuwaitKyrgyz RepublicLao PDRLate-demographic dividendLatin America & Caribbean Latin America & Caribbean (excluding high income)Latin America & the Caribbean (IDA & IBRD countries)LatviaLeast developed countries: UN classificationLebanonLesothoLiberiaLibyaLithuaniaLow & middle incomeLow incomeLower middle incomeLuxembourgMacao SAR, ChinaMacedonia, FYRMadagascarMalawiMalaysiaMaldivesMaliMaltaMauritaniaMauritiusMexicoMicronesia, Fed. Sts.Middle East & North AfricaMiddle East & North Africa (excluding high income)Middle East & North Africa (IDA & IBRD countries)Middle incomeMoldovaMongoliaMontenegroMoroccoMozambiqueMyanmarNamibiaNepalNetherlandsNew CaledoniaNew ZealandNicaraguaNigerNigeriaNorth AmericaNorwayOECD membersOmanOther small statesPacific island small statesPakistanPanamaPapua New GuineaParaguayPeruPhilippinesPolandPortugalPost-demographic dividendPre-demographic dividendPuerto RicoQatarRomaniaRussian FederationRwandaSamoaSao Tome and PrincipeSaudi ArabiaSenegalSerbiaSeychellesSierra LeoneSingaporeSlovak RepublicSloveniaSmall statesSolomon IslandsSomaliaSouth AfricaSouth AsiaSouth Asia (IDA & IBRD)South SudanSpainSri LankaSt. LuciaSt. Vincent and the GrenadinesSub-Saharan Africa Sub-Saharan Africa (excluding high income)Sub-Saharan Africa (IDA & IBRD countries)SudanSurinameSwazilandSwedenSwitzerlandSyrian Arab RepublicTajikistanTanzaniaThailandTimor-LesteTogoTongaTrinidad and TobagoTunisiaTurkeyTurkmenistanUgandaUkraineUnited Arab EmiratesUnited KingdomUnited StatesUpper middle incomeUruguayUzbekistanVanuatuVenezuela, RBVietnamVirgin Islands (U.S.)West Bank and GazaWorldYemen, Rep.ZambiaZimbabwe Timeline:
This timeline shows a graph from 1961 to 2016 of Morocco. No data until 1960. Number of actual observations by date: 56.
Source name:
World Development Indicators
Source organization:
United Nations Population Division, World Population Prospects.
Categories, topics:
Health, Gender, Social Development
Last updated:
apr 23, 2017
Indicators value changes by year
Minimum:
31.365
jan 1, 2016
Maximum:
153.34
jan 1, 1963
At the date of observation
Value
Absolute change
Change from previous value
jan 1, 1961
151.161
+151.161
0.0%
jan 1, 1962
152.251
+1.089
0.72%
jan 1, 1963
153.34
+1.089
0.72%
jan 1, 1964
152.269
-1.071
-0.7%
jan 1, 1965
151.199
-1.071
-0.7%
jan 1, 1966
150.128
-1.071
-0.71%
jan 1, 1967
149.058
-1.071
-0.71%
jan 1, 1968
147.987
-1.071
-0.72%
jan 1, 1969
143.966
-4.021
-2.72%
jan 1, 1970
139.946
-4.021
-2.79%
jan 1, 1971
135.925
-4.021
-2.87%
jan 1, 1972
131.905
-4.021
-2.96%
jan 1, 1973
127.884
-4.021
-3.05%
jan 1, 1974
123.689
-4.195
-3.28%
jan 1, 1975
119.494
-4.195
-3.39%
jan 1, 1976
115.298
-4.195
-3.51%
jan 1, 1977
111.103
-4.195
-3.64%
jan 1, 1978
106.908
-4.195
-3.78%
jan 1, 1979
99.923
-6.985
-6.53%
jan 1, 1980
92.938
-6.985
-6.99%
jan 1, 1981
85.952
-6.985
-7.52%
jan 1, 1982
78.967
-6.985
-8.13%
jan 1, 1983
71.982
-6.985
-8.85%
jan 1, 1984
66.702
-5.28
-7.34%
jan 1, 1985
61.422
-5.28
-7.92%
jan 1, 1986
56.142
-5.28
-8.6%
jan 1, 1987
50.862
-5.28
-9.4%
jan 1, 1988
45.582
-5.28
-10.38%
jan 1, 1989
43.887
-1.695
-3.72%
jan 1, 1990
42.192
-1.695
-3.86%
jan 1, 1991
40.496
-1.695
-4.02%
jan 1, 1992
38.801
-1.695
-4.19%
jan 1, 1993
37.106
-1.695
-4.37%
jan 1, 1994
36.468
-0.638
-1.72%
jan 1, 1995
35.831
-0.638
-1.75%
jan 1, 1996
35.193
-0.638
-1.78%
jan 1, 1997
34.556
-0.638
-1.81%
jan 1, 1998
33.918
-0.638
-1.85%
jan 1, 1999
33.934
+0.016
0.05%
jan 1, 2000
33.95
+0.016
0.05%
jan 1, 2001
33.965
+0.016
0.05%
jan 1, 2002
33.981
+0.016
0.05%
jan 1, 2003
33.997
+0.016
0.05%
jan 1, 2004
33.711
-0.286
-0.84%
jan 1, 2005
33.426
-0.286
-0.85%
jan 1, 2006
33.14
-0.286
-0.85%
jan 1, 2007
32.855
-0.286
-0.86%
jan 1, 2008
32.569
-0.286
-0.87%
jan 1, 2009
32.752
+0.183
0.56%
jan 1, 2010
32.935
+0.183
0.56%
jan 1, 2011
33.119
+0.183
0.56%
jan 1, 2012
33.302
+0.183
0.55%
jan 1, 2013
33.485
+0.183
0.55%
jan 1, 2014
32.778
-0.707
-2.11%
jan 1, 2015
32.072
-0.707
-2.16%
jan 1, 2016
31.365
-0.707
-2.2%
Ranking of countries by current statistics by years


Comments: