29
/
en
AIzaSyAYiBZKx7MnpbEhh9jyipgxe19OcubqV5w
April 1, 2024
243316
Solomon Islands
SLB
true
2
1
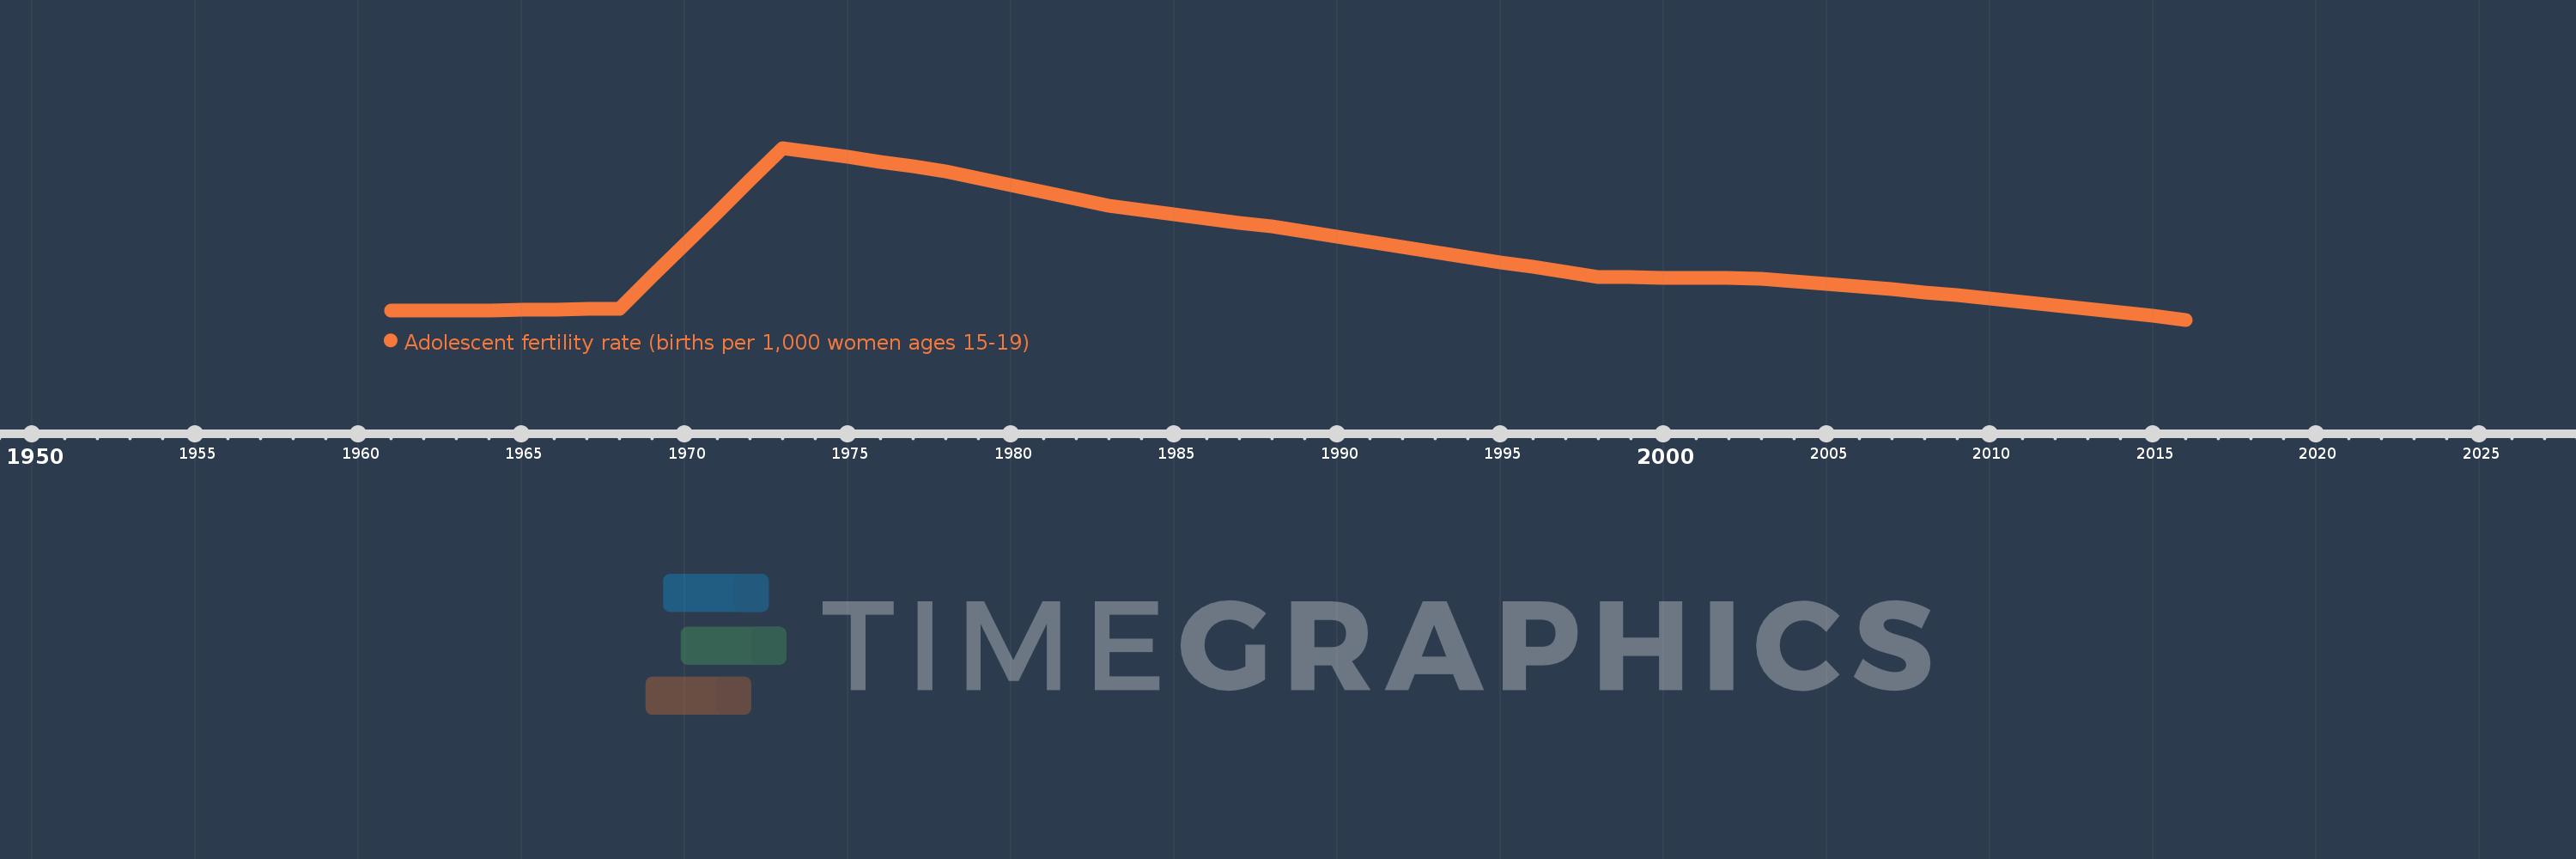
Adolescent fertility rate (births per 1,000 women ages 15-19)
2016,2015,2014,2013,2012,2011,2010,2009,2008,2007,2006,2005,2004,2003,2002,2001,2000,1999,1998,1997,1996,1995,1994,1993,1992,1991,1990,1989,1988,1987,1986,1985,1984,1983,1982,1981,1980,1979,1978,1977,1976,1975,1974,1973,1972,1971,1970,1969,1968,1967,1966,1965,1964,1963,1962,1961
This statistics in other country:
AfghanistanAlbaniaAlgeriaAngolaAntigua and BarbudaArab WorldArgentinaArmeniaArubaAustraliaAustriaAzerbaijanBahamas, TheBahrainBangladeshBarbadosBelarusBelgiumBelizeBeninBhutanBoliviaBosnia and HerzegovinaBotswanaBrazilBrunei DarussalamBulgariaBurkina FasoBurundiCabo VerdeCambodiaCameroonCanadaCaribbean small statesCentral African RepublicCentral Europe and the BalticsChadChannel IslandsChileChinaColombiaComorosCongo, Dem. Rep.Congo, Rep.Costa RicaCote d'IvoireCroatiaCubaCuracaoCyprusCzech RepublicDenmarkDjiboutiDominican RepublicEarly-demographic dividendEast Asia & PacificEast Asia & Pacific (excluding high income)East Asia & Pacific (IDA & IBRD countries)EcuadorEgypt, Arab Rep.El SalvadorEquatorial GuineaEritreaEstoniaEthiopiaEuro areaEurope & Central AsiaEurope & Central Asia (excluding high income)Europe & Central Asia (IDA & IBRD countries)European UnionFijiFinlandFragile and conflict affected situationsFranceFrench PolynesiaGabonGambia, TheGeorgiaGermanyGhanaGreeceGrenadaGuamGuatemalaGuineaGuinea-BissauGuyanaHaitiHeavily indebted poor countries (HIPC)High incomeHondurasHong Kong SAR, ChinaHungaryIBRD onlyIcelandIDA & IBRD totalIDA blendIDA onlyIDA totalIndiaIndonesiaIran, Islamic Rep.IraqIrelandIsraelItalyJamaicaJapanJordanKazakhstanKenyaKiribatiKorea, Dem. People’s Rep.Korea, Rep.KuwaitKyrgyz RepublicLao PDRLate-demographic dividendLatin America & Caribbean Latin America & Caribbean (excluding high income)Latin America & the Caribbean (IDA & IBRD countries)LatviaLeast developed countries: UN classificationLebanonLesothoLiberiaLibyaLithuaniaLow & middle incomeLow incomeLower middle incomeLuxembourgMacao SAR, ChinaMacedonia, FYRMadagascarMalawiMalaysiaMaldivesMaliMaltaMauritaniaMauritiusMexicoMicronesia, Fed. Sts.Middle East & North AfricaMiddle East & North Africa (excluding high income)Middle East & North Africa (IDA & IBRD countries)Middle incomeMoldovaMongoliaMontenegroMoroccoMozambiqueMyanmarNamibiaNepalNetherlandsNew CaledoniaNew ZealandNicaraguaNigerNigeriaNorth AmericaNorwayOECD membersOmanOther small statesPacific island small statesPakistanPanamaPapua New GuineaParaguayPeruPhilippinesPolandPortugalPost-demographic dividendPre-demographic dividendPuerto RicoQatarRomaniaRussian FederationRwandaSamoaSao Tome and PrincipeSaudi ArabiaSenegalSerbiaSeychellesSierra LeoneSingaporeSlovak RepublicSloveniaSmall statesSolomon IslandsSomaliaSouth AfricaSouth AsiaSouth Asia (IDA & IBRD)South SudanSpainSri LankaSt. LuciaSt. Vincent and the GrenadinesSub-Saharan Africa Sub-Saharan Africa (excluding high income)Sub-Saharan Africa (IDA & IBRD countries)SudanSurinameSwazilandSwedenSwitzerlandSyrian Arab RepublicTajikistanTanzaniaThailandTimor-LesteTogoTongaTrinidad and TobagoTunisiaTurkeyTurkmenistanUgandaUkraineUnited Arab EmiratesUnited KingdomUnited StatesUpper middle incomeUruguayUzbekistanVanuatuVenezuela, RBVietnamVirgin Islands (U.S.)West Bank and GazaWorldYemen, Rep.ZambiaZimbabwe Timeline:
This timeline shows a graph from 1961 to 2016 of Solomon Islands. No data until 1960. Number of actual observations by date: 56.
Source name:
World Development Indicators
Source organization:
United Nations Population Division, World Population Prospects.
Categories, topics:
Health, Gender, Social Development
Last updated:
apr 23, 2017
Indicators value changes by year
Minimum:
47.379
jan 1, 2016
Maximum:
142.477
jan 1, 1973
At the date of observation
Value
Absolute change
Change from previous value
jan 1, 1961
52.416
+52.416
0.0%
jan 1, 1962
52.416
0.0
0.0%
jan 1, 1963
52.416
0.0
0.0%
jan 1, 1964
52.644
+0.228
0.43%
jan 1, 1965
52.871
+0.228
0.43%
jan 1, 1966
53.099
+0.228
0.43%
jan 1, 1967
53.326
+0.228
0.43%
jan 1, 1968
53.554
+0.228
0.43%
jan 1, 1969
71.339
+17.785
33.21%
jan 1, 1970
89.123
+17.785
24.93%
jan 1, 1971
106.908
+17.785
19.96%
jan 1, 1972
124.692
+17.785
16.64%
jan 1, 1973
142.477
+17.785
14.26%
jan 1, 1974
139.918
-2.559
-1.8%
jan 1, 1975
137.359
-2.559
-1.83%
jan 1, 1976
134.799
-2.559
-1.86%
jan 1, 1977
132.24
-2.559
-1.9%
jan 1, 1978
129.681
-2.559
-1.94%
jan 1, 1979
125.801
-3.88
-2.99%
jan 1, 1980
121.92
-3.88
-3.08%
jan 1, 1981
118.04
-3.88
-3.18%
jan 1, 1982
114.159
-3.88
-3.29%
jan 1, 1983
110.279
-3.88
-3.4%
jan 1, 1984
108.002
-2.277
-2.06%
jan 1, 1985
105.725
-2.277
-2.11%
jan 1, 1986
103.448
-2.277
-2.15%
jan 1, 1987
101.171
-2.277
-2.2%
jan 1, 1988
98.894
-2.277
-2.25%
jan 1, 1989
96.067
-2.827
-2.86%
jan 1, 1990
93.241
-2.827
-2.94%
jan 1, 1991
90.414
-2.827
-3.03%
jan 1, 1992
87.588
-2.827
-3.13%
jan 1, 1993
84.761
-2.827
-3.23%
jan 1, 1994
82.033
-2.728
-3.22%
jan 1, 1995
79.306
-2.728
-3.32%
jan 1, 1996
76.578
-2.728
-3.44%
jan 1, 1997
73.851
-2.728
-3.56%
jan 1, 1998
71.123
-2.728
-3.69%
jan 1, 1999
70.921
-0.202
-0.28%
jan 1, 2000
70.719
-0.202
-0.28%
jan 1, 2001
70.517
-0.202
-0.29%
jan 1, 2002
70.315
-0.202
-0.29%
jan 1, 2003
70.113
-0.202
-0.29%
jan 1, 2004
68.615
-1.498
-2.14%
jan 1, 2005
67.116
-1.498
-2.18%
jan 1, 2006
65.618
-1.498
-2.23%
jan 1, 2007
64.119
-1.498
-2.28%
jan 1, 2008
62.621
-1.498
-2.34%
jan 1, 2009
60.827
-1.794
-2.87%
jan 1, 2010
59.033
-1.794
-2.95%
jan 1, 2011
57.238
-1.794
-3.04%
jan 1, 2012
55.444
-1.794
-3.13%
jan 1, 2013
53.65
-1.794
-3.24%
jan 1, 2014
51.56
-2.09
-3.9%
jan 1, 2015
49.47
-2.09
-4.05%
jan 1, 2016
47.379
-2.09
-4.23%
Ranking of countries by current statistics by years


Comments: