29
/
en
AIzaSyAYiBZKx7MnpbEhh9jyipgxe19OcubqV5w
April 1, 2024
149939
Honduras
HND
true
2
1
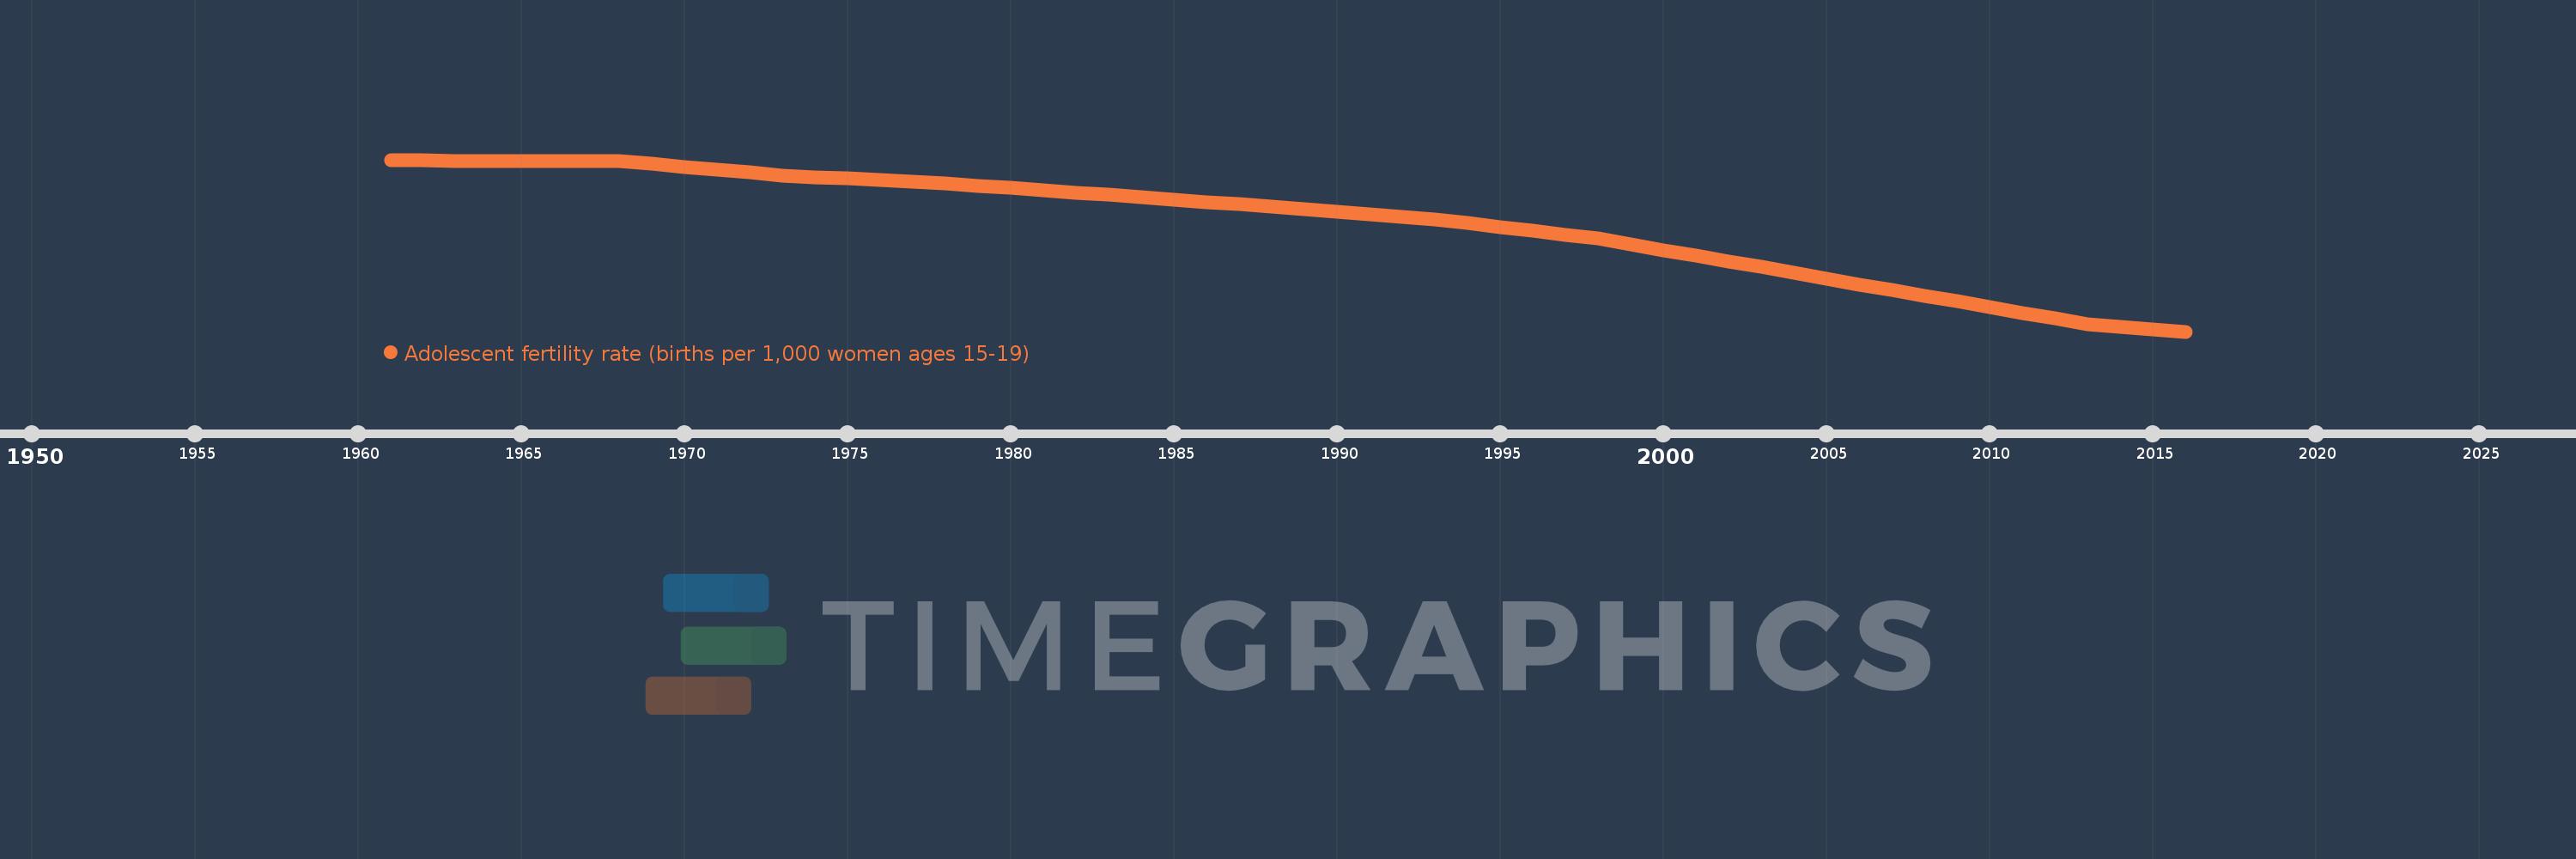
Adolescent fertility rate (births per 1,000 women ages 15-19)
2016,2015,2014,2013,2012,2011,2010,2009,2008,2007,2006,2005,2004,2003,2002,2001,2000,1999,1998,1997,1996,1995,1994,1993,1992,1991,1990,1989,1988,1987,1986,1985,1984,1983,1982,1981,1980,1979,1978,1977,1976,1975,1974,1973,1972,1971,1970,1969,1968,1967,1966,1965,1964,1963,1962,1961
This statistics in other country:
AfghanistanAlbaniaAlgeriaAngolaAntigua and BarbudaArab WorldArgentinaArmeniaArubaAustraliaAustriaAzerbaijanBahamas, TheBahrainBangladeshBarbadosBelarusBelgiumBelizeBeninBhutanBoliviaBosnia and HerzegovinaBotswanaBrazilBrunei DarussalamBulgariaBurkina FasoBurundiCabo VerdeCambodiaCameroonCanadaCaribbean small statesCentral African RepublicCentral Europe and the BalticsChadChannel IslandsChileChinaColombiaComorosCongo, Dem. Rep.Congo, Rep.Costa RicaCote d'IvoireCroatiaCubaCuracaoCyprusCzech RepublicDenmarkDjiboutiDominican RepublicEarly-demographic dividendEast Asia & PacificEast Asia & Pacific (excluding high income)East Asia & Pacific (IDA & IBRD countries)EcuadorEgypt, Arab Rep.El SalvadorEquatorial GuineaEritreaEstoniaEthiopiaEuro areaEurope & Central AsiaEurope & Central Asia (excluding high income)Europe & Central Asia (IDA & IBRD countries)European UnionFijiFinlandFragile and conflict affected situationsFranceFrench PolynesiaGabonGambia, TheGeorgiaGermanyGhanaGreeceGrenadaGuamGuatemalaGuineaGuinea-BissauGuyanaHaitiHeavily indebted poor countries (HIPC)High incomeHondurasHong Kong SAR, ChinaHungaryIBRD onlyIcelandIDA & IBRD totalIDA blendIDA onlyIDA totalIndiaIndonesiaIran, Islamic Rep.IraqIrelandIsraelItalyJamaicaJapanJordanKazakhstanKenyaKiribatiKorea, Dem. People’s Rep.Korea, Rep.KuwaitKyrgyz RepublicLao PDRLate-demographic dividendLatin America & Caribbean Latin America & Caribbean (excluding high income)Latin America & the Caribbean (IDA & IBRD countries)LatviaLeast developed countries: UN classificationLebanonLesothoLiberiaLibyaLithuaniaLow & middle incomeLow incomeLower middle incomeLuxembourgMacao SAR, ChinaMacedonia, FYRMadagascarMalawiMalaysiaMaldivesMaliMaltaMauritaniaMauritiusMexicoMicronesia, Fed. Sts.Middle East & North AfricaMiddle East & North Africa (excluding high income)Middle East & North Africa (IDA & IBRD countries)Middle incomeMoldovaMongoliaMontenegroMoroccoMozambiqueMyanmarNamibiaNepalNetherlandsNew CaledoniaNew ZealandNicaraguaNigerNigeriaNorth AmericaNorwayOECD membersOmanOther small statesPacific island small statesPakistanPanamaPapua New GuineaParaguayPeruPhilippinesPolandPortugalPost-demographic dividendPre-demographic dividendPuerto RicoQatarRomaniaRussian FederationRwandaSamoaSao Tome and PrincipeSaudi ArabiaSenegalSerbiaSeychellesSierra LeoneSingaporeSlovak RepublicSloveniaSmall statesSolomon IslandsSomaliaSouth AfricaSouth AsiaSouth Asia (IDA & IBRD)South SudanSpainSri LankaSt. LuciaSt. Vincent and the GrenadinesSub-Saharan Africa Sub-Saharan Africa (excluding high income)Sub-Saharan Africa (IDA & IBRD countries)SudanSurinameSwazilandSwedenSwitzerlandSyrian Arab RepublicTajikistanTanzaniaThailandTimor-LesteTogoTongaTrinidad and TobagoTunisiaTurkeyTurkmenistanUgandaUkraineUnited Arab EmiratesUnited KingdomUnited StatesUpper middle incomeUruguayUzbekistanVanuatuVenezuela, RBVietnamVirgin Islands (U.S.)West Bank and GazaWorldYemen, Rep.ZambiaZimbabwe Timeline:
This timeline shows a graph from 1961 to 2016 of Honduras. No data until 1960. Number of actual observations by date: 56.
Source name:
World Development Indicators
Source organization:
United Nations Population Division, World Population Prospects.
Categories, topics:
Health, Gender, Social Development
Last updated:
apr 23, 2017
Indicators value changes by year
Minimum:
64.268
jan 1, 2016
Maximum:
159.419
jan 1, 1961
At the date of observation
Value
Absolute change
Change from previous value
jan 1, 1961
159.419
+159.419
0.0%
jan 1, 1962
159.06
-0.359
-0.23%
jan 1, 1963
158.701
-0.359
-0.23%
jan 1, 1964
158.72
+0.019
0.01%
jan 1, 1965
158.739
+0.019
0.01%
jan 1, 1966
158.758
+0.019
0.01%
jan 1, 1967
158.777
+0.019
0.01%
jan 1, 1968
158.796
+0.019
0.01%
jan 1, 1969
157.197
-1.599
-1.01%
jan 1, 1970
155.598
-1.599
-1.02%
jan 1, 1971
153.998
-1.599
-1.03%
jan 1, 1972
152.399
-1.599
-1.04%
jan 1, 1973
150.8
-1.599
-1.05%
jan 1, 1974
149.88
-0.92
-0.61%
jan 1, 1975
148.961
-0.92
-0.61%
jan 1, 1976
148.041
-0.92
-0.62%
jan 1, 1977
147.122
-0.92
-0.62%
jan 1, 1978
146.202
-0.92
-0.63%
jan 1, 1979
144.962
-1.24
-0.85%
jan 1, 1980
143.723
-1.24
-0.86%
jan 1, 1981
142.483
-1.24
-0.86%
jan 1, 1982
141.244
-1.24
-0.87%
jan 1, 1983
140.004
-1.24
-0.88%
jan 1, 1984
138.703
-1.301
-0.93%
jan 1, 1985
137.401
-1.301
-0.94%
jan 1, 1986
136.1
-1.301
-0.95%
jan 1, 1987
134.798
-1.301
-0.96%
jan 1, 1988
133.497
-1.301
-0.97%
jan 1, 1989
132.097
-1.4
-1.05%
jan 1, 1990
130.698
-1.4
-1.06%
jan 1, 1991
129.298
-1.4
-1.07%
jan 1, 1992
127.899
-1.4
-1.08%
jan 1, 1993
126.499
-1.4
-1.09%
jan 1, 1994
124.351
-2.148
-1.7%
jan 1, 1995
122.203
-2.148
-1.73%
jan 1, 1996
120.055
-2.148
-1.76%
jan 1, 1997
117.907
-2.148
-1.79%
jan 1, 1998
115.759
-2.148
-1.82%
jan 1, 1999
112.599
-3.16
-2.73%
jan 1, 2000
109.439
-3.16
-2.81%
jan 1, 2001
106.28
-3.16
-2.89%
jan 1, 2002
103.12
-3.16
-2.97%
jan 1, 2003
99.96
-3.16
-3.06%
jan 1, 2004
96.78
-3.18
-3.18%
jan 1, 2005
93.601
-3.18
-3.29%
jan 1, 2006
90.421
-3.18
-3.4%
jan 1, 2007
87.242
-3.18
-3.52%
jan 1, 2008
84.062
-3.18
-3.64%
jan 1, 2009
80.937
-3.125
-3.72%
jan 1, 2010
77.813
-3.125
-3.86%
jan 1, 2011
74.688
-3.125
-4.02%
jan 1, 2012
71.564
-3.125
-4.18%
jan 1, 2013
68.439
-3.125
-4.37%
jan 1, 2014
67.049
-1.39
-2.03%
jan 1, 2015
65.659
-1.39
-2.07%
jan 1, 2016
64.268
-1.39
-2.12%
Ranking of countries by current statistics by years


Comments: