29
/
en
AIzaSyAYiBZKx7MnpbEhh9jyipgxe19OcubqV5w
April 1, 2024
55299
Pre-demographic dividend
PRE
false
2
1
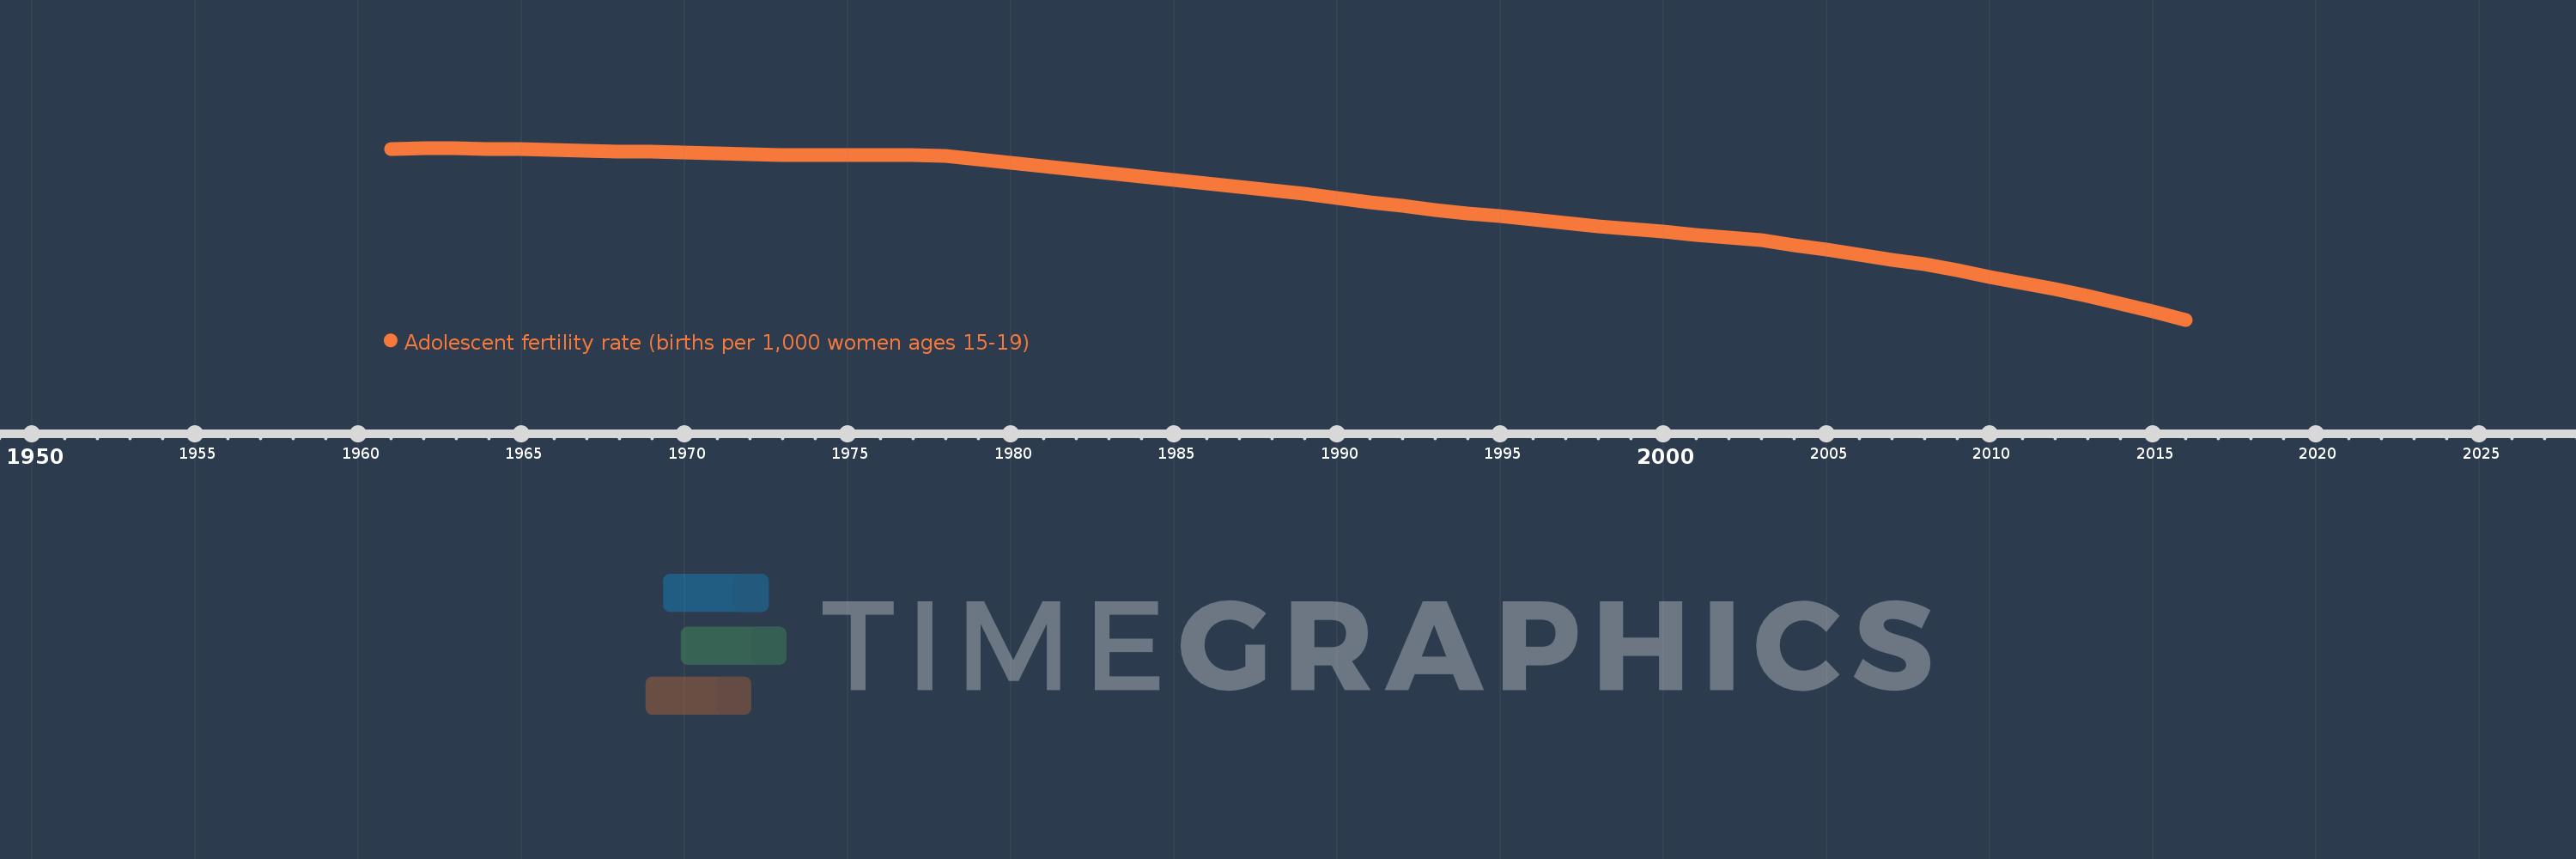
Adolescent fertility rate (births per 1,000 women ages 15-19)
2016,2015,2014,2013,2012,2011,2010,2009,2008,2007,2006,2005,2004,2003,2002,2001,2000,1999,1998,1997,1996,1995,1994,1993,1992,1991,1990,1989,1988,1987,1986,1985,1984,1983,1982,1981,1980,1979,1978,1977,1976,1975,1974,1973,1972,1971,1970,1969,1968,1967,1966,1965,1964,1963,1962,1961
This statistics in other country:
AfghanistanAlbaniaAlgeriaAngolaAntigua and BarbudaArab WorldArgentinaArmeniaArubaAustraliaAustriaAzerbaijanBahamas, TheBahrainBangladeshBarbadosBelarusBelgiumBelizeBeninBhutanBoliviaBosnia and HerzegovinaBotswanaBrazilBrunei DarussalamBulgariaBurkina FasoBurundiCabo VerdeCambodiaCameroonCanadaCaribbean small statesCentral African RepublicCentral Europe and the BalticsChadChannel IslandsChileChinaColombiaComorosCongo, Dem. Rep.Congo, Rep.Costa RicaCote d'IvoireCroatiaCubaCuracaoCyprusCzech RepublicDenmarkDjiboutiDominican RepublicEarly-demographic dividendEast Asia & PacificEast Asia & Pacific (excluding high income)East Asia & Pacific (IDA & IBRD countries)EcuadorEgypt, Arab Rep.El SalvadorEquatorial GuineaEritreaEstoniaEthiopiaEuro areaEurope & Central AsiaEurope & Central Asia (excluding high income)Europe & Central Asia (IDA & IBRD countries)European UnionFijiFinlandFragile and conflict affected situationsFranceFrench PolynesiaGabonGambia, TheGeorgiaGermanyGhanaGreeceGrenadaGuamGuatemalaGuineaGuinea-BissauGuyanaHaitiHeavily indebted poor countries (HIPC)High incomeHondurasHong Kong SAR, ChinaHungaryIBRD onlyIcelandIDA & IBRD totalIDA blendIDA onlyIDA totalIndiaIndonesiaIran, Islamic Rep.IraqIrelandIsraelItalyJamaicaJapanJordanKazakhstanKenyaKiribatiKorea, Dem. People’s Rep.Korea, Rep.KuwaitKyrgyz RepublicLao PDRLate-demographic dividendLatin America & Caribbean Latin America & Caribbean (excluding high income)Latin America & the Caribbean (IDA & IBRD countries)LatviaLeast developed countries: UN classificationLebanonLesothoLiberiaLibyaLithuaniaLow & middle incomeLow incomeLower middle incomeLuxembourgMacao SAR, ChinaMacedonia, FYRMadagascarMalawiMalaysiaMaldivesMaliMaltaMauritaniaMauritiusMexicoMicronesia, Fed. Sts.Middle East & North AfricaMiddle East & North Africa (excluding high income)Middle East & North Africa (IDA & IBRD countries)Middle incomeMoldovaMongoliaMontenegroMoroccoMozambiqueMyanmarNamibiaNepalNetherlandsNew CaledoniaNew ZealandNicaraguaNigerNigeriaNorth AmericaNorwayOECD membersOmanOther small statesPacific island small statesPakistanPanamaPapua New GuineaParaguayPeruPhilippinesPolandPortugalPost-demographic dividendPre-demographic dividendPuerto RicoQatarRomaniaRussian FederationRwandaSamoaSao Tome and PrincipeSaudi ArabiaSenegalSerbiaSeychellesSierra LeoneSingaporeSlovak RepublicSloveniaSmall statesSolomon IslandsSomaliaSouth AfricaSouth AsiaSouth Asia (IDA & IBRD)South SudanSpainSri LankaSt. LuciaSt. Vincent and the GrenadinesSub-Saharan Africa Sub-Saharan Africa (excluding high income)Sub-Saharan Africa (IDA & IBRD countries)SudanSurinameSwazilandSwedenSwitzerlandSyrian Arab RepublicTajikistanTanzaniaThailandTimor-LesteTogoTongaTrinidad and TobagoTunisiaTurkeyTurkmenistanUgandaUkraineUnited Arab EmiratesUnited KingdomUnited StatesUpper middle incomeUruguayUzbekistanVanuatuVenezuela, RBVietnamVirgin Islands (U.S.)West Bank and GazaWorldYemen, Rep.ZambiaZimbabwe Timeline:
This timeline shows a graph from 1961 to 2016 of Pre-demographic dividend. No data until 1960. Number of actual observations by date: 56.
Source name:
World Development Indicators
Source organization:
United Nations Population Division, World Population Prospects.
Categories, topics:
Health, Gender, Social Development
Last updated:
apr 23, 2017
Indicators value changes by year
Minimum:
109.595
jan 1, 2016
Maximum:
165.974
jan 1, 1963
At the date of observation
Value
Absolute change
Change from previous value
jan 1, 1961
165.728
+165.728
0.0%
jan 1, 1962
165.852
+0.124
0.08%
jan 1, 1963
165.974
+0.122
0.07%
jan 1, 1964
165.74
-0.234
-0.14%
jan 1, 1965
165.512
-0.228
-0.14%
jan 1, 1966
165.298
-0.215
-0.13%
jan 1, 1967
165.091
-0.206
-0.12%
jan 1, 1968
164.894
-0.197
-0.12%
jan 1, 1969
164.643
-0.251
-0.15%
jan 1, 1970
164.37
-0.274
-0.17%
jan 1, 1971
164.098
-0.272
-0.17%
jan 1, 1972
163.87
-0.228
-0.14%
jan 1, 1973
163.681
-0.19
-0.12%
jan 1, 1974
163.742
+0.061
0.04%
jan 1, 1975
163.768
+0.026
0.02%
jan 1, 1976
163.73
-0.038
-0.02%
jan 1, 1977
163.587
-0.143
-0.09%
jan 1, 1978
163.399
-0.188
-0.11%
jan 1, 1979
162.222
-1.177
-0.72%
jan 1, 1980
161.057
-1.165
-0.72%
jan 1, 1981
159.92
-1.137
-0.71%
jan 1, 1982
158.824
-1.096
-0.69%
jan 1, 1983
157.746
-1.079
-0.68%
jan 1, 1984
156.61
-1.136
-0.72%
jan 1, 1985
155.488
-1.122
-0.72%
jan 1, 1986
154.385
-1.103
-0.71%
jan 1, 1987
153.274
-1.111
-0.72%
jan 1, 1988
152.183
-1.091
-0.71%
jan 1, 1989
150.895
-1.288
-0.85%
jan 1, 1990
149.586
-1.31
-0.87%
jan 1, 1991
148.255
-1.331
-0.89%
jan 1, 1992
146.907
-1.348
-0.91%
jan 1, 1993
145.553
-1.354
-0.92%
jan 1, 1994
144.532
-1.022
-0.7%
jan 1, 1995
143.492
-1.04
-0.72%
jan 1, 1996
142.436
-1.055
-0.74%
jan 1, 1997
141.367
-1.07
-0.75%
jan 1, 1998
140.296
-1.07
-0.76%
jan 1, 1999
139.379
-0.917
-0.65%
jan 1, 2000
138.463
-0.916
-0.66%
jan 1, 2001
137.551
-0.912
-0.66%
jan 1, 2002
136.642
-0.909
-0.66%
jan 1, 2003
135.736
-0.906
-0.66%
jan 1, 2004
134.11
-1.626
-1.2%
jan 1, 2005
132.5
-1.609
-1.2%
jan 1, 2006
130.917
-1.583
-1.2%
jan 1, 2007
129.347
-1.57
-1.2%
jan 1, 2008
127.804
-1.543
-1.19%
jan 1, 2009
125.776
-2.028
-1.59%
jan 1, 2010
123.736
-2.04
-1.62%
jan 1, 2011
121.673
-2.063
-1.67%
jan 1, 2012
119.566
-2.107
-1.73%
jan 1, 2013
117.444
-2.122
-1.77%
jan 1, 2014
114.834
-2.61
-2.22%
jan 1, 2015
112.217
-2.617
-2.28%
jan 1, 2016
109.595
-2.621
-2.34%
Ranking of countries by current statistics by years


Comments: