29
/
en
AIzaSyAYiBZKx7MnpbEhh9jyipgxe19OcubqV5w
April 1, 2024
223143
Philippines
PHL
true
2
1
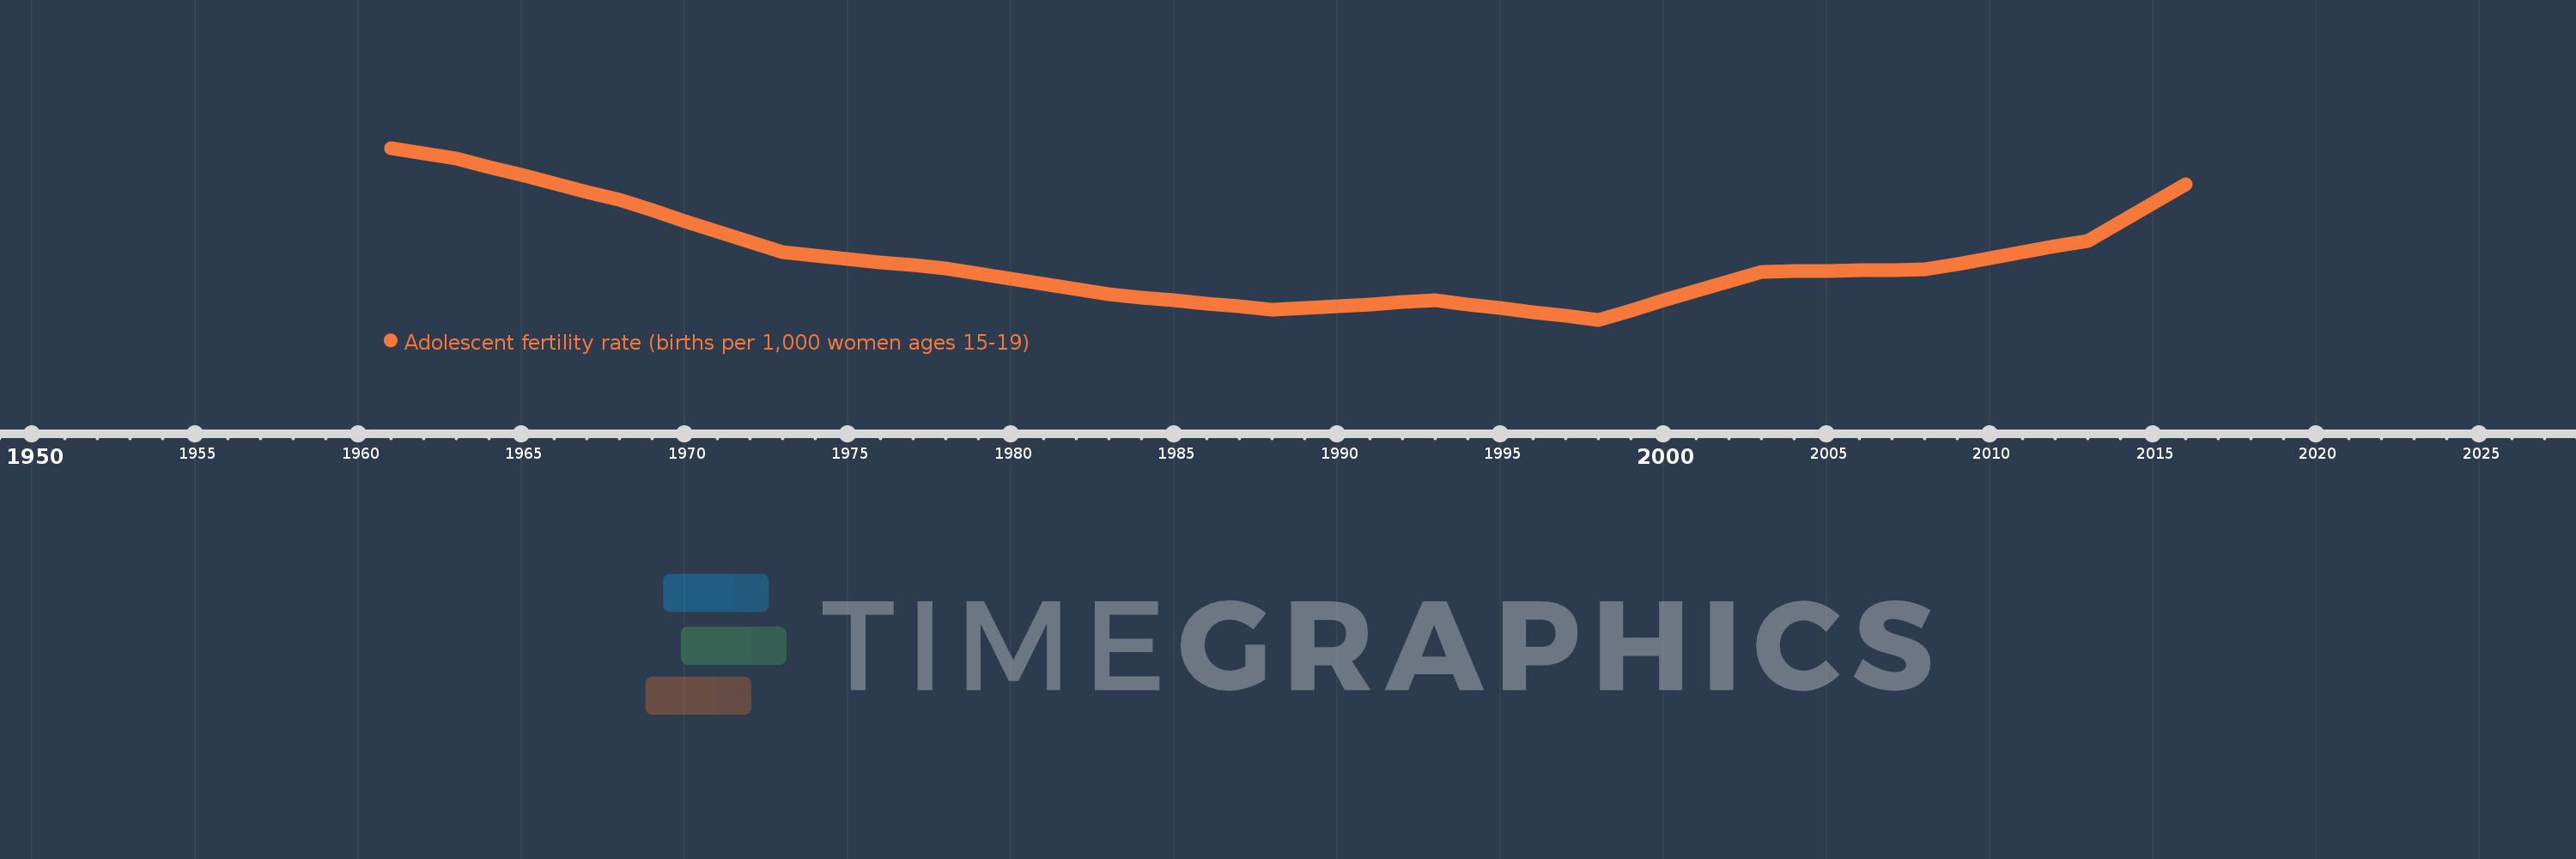
Adolescent fertility rate (births per 1,000 women ages 15-19)
2016,2015,2014,2013,2012,2011,2010,2009,2008,2007,2006,2005,2004,2003,2002,2001,2000,1999,1998,1997,1996,1995,1994,1993,1992,1991,1990,1989,1988,1987,1986,1985,1984,1983,1982,1981,1980,1979,1978,1977,1976,1975,1974,1973,1972,1971,1970,1969,1968,1967,1966,1965,1964,1963,1962,1961
This statistics in other country:
AfghanistanAlbaniaAlgeriaAngolaAntigua and BarbudaArab WorldArgentinaArmeniaArubaAustraliaAustriaAzerbaijanBahamas, TheBahrainBangladeshBarbadosBelarusBelgiumBelizeBeninBhutanBoliviaBosnia and HerzegovinaBotswanaBrazilBrunei DarussalamBulgariaBurkina FasoBurundiCabo VerdeCambodiaCameroonCanadaCaribbean small statesCentral African RepublicCentral Europe and the BalticsChadChannel IslandsChileChinaColombiaComorosCongo, Dem. Rep.Congo, Rep.Costa RicaCote d'IvoireCroatiaCubaCuracaoCyprusCzech RepublicDenmarkDjiboutiDominican RepublicEarly-demographic dividendEast Asia & PacificEast Asia & Pacific (excluding high income)East Asia & Pacific (IDA & IBRD countries)EcuadorEgypt, Arab Rep.El SalvadorEquatorial GuineaEritreaEstoniaEthiopiaEuro areaEurope & Central AsiaEurope & Central Asia (excluding high income)Europe & Central Asia (IDA & IBRD countries)European UnionFijiFinlandFragile and conflict affected situationsFranceFrench PolynesiaGabonGambia, TheGeorgiaGermanyGhanaGreeceGrenadaGuamGuatemalaGuineaGuinea-BissauGuyanaHaitiHeavily indebted poor countries (HIPC)High incomeHondurasHong Kong SAR, ChinaHungaryIBRD onlyIcelandIDA & IBRD totalIDA blendIDA onlyIDA totalIndiaIndonesiaIran, Islamic Rep.IraqIrelandIsraelItalyJamaicaJapanJordanKazakhstanKenyaKiribatiKorea, Dem. People’s Rep.Korea, Rep.KuwaitKyrgyz RepublicLao PDRLate-demographic dividendLatin America & Caribbean Latin America & Caribbean (excluding high income)Latin America & the Caribbean (IDA & IBRD countries)LatviaLeast developed countries: UN classificationLebanonLesothoLiberiaLibyaLithuaniaLow & middle incomeLow incomeLower middle incomeLuxembourgMacao SAR, ChinaMacedonia, FYRMadagascarMalawiMalaysiaMaldivesMaliMaltaMauritaniaMauritiusMexicoMicronesia, Fed. Sts.Middle East & North AfricaMiddle East & North Africa (excluding high income)Middle East & North Africa (IDA & IBRD countries)Middle incomeMoldovaMongoliaMontenegroMoroccoMozambiqueMyanmarNamibiaNepalNetherlandsNew CaledoniaNew ZealandNicaraguaNigerNigeriaNorth AmericaNorwayOECD membersOmanOther small statesPacific island small statesPakistanPanamaPapua New GuineaParaguayPeruPhilippinesPolandPortugalPost-demographic dividendPre-demographic dividendPuerto RicoQatarRomaniaRussian FederationRwandaSamoaSao Tome and PrincipeSaudi ArabiaSenegalSerbiaSeychellesSierra LeoneSingaporeSlovak RepublicSloveniaSmall statesSolomon IslandsSomaliaSouth AfricaSouth AsiaSouth Asia (IDA & IBRD)South SudanSpainSri LankaSt. LuciaSt. Vincent and the GrenadinesSub-Saharan Africa Sub-Saharan Africa (excluding high income)Sub-Saharan Africa (IDA & IBRD countries)SudanSurinameSwazilandSwedenSwitzerlandSyrian Arab RepublicTajikistanTanzaniaThailandTimor-LesteTogoTongaTrinidad and TobagoTunisiaTurkeyTurkmenistanUgandaUkraineUnited Arab EmiratesUnited KingdomUnited StatesUpper middle incomeUruguayUzbekistanVanuatuVenezuela, RBVietnamVirgin Islands (U.S.)West Bank and GazaWorldYemen, Rep.ZambiaZimbabwe Timeline:
This timeline shows a graph from 1961 to 2016 of Philippines. No data until 1960. Number of actual observations by date: 56.
Source name:
World Development Indicators
Source organization:
United Nations Population Division, World Population Prospects.
Categories, topics:
Health, Gender, Social Development
Last updated:
apr 23, 2017
Indicators value changes by year
Minimum:
49.062
jan 1, 1998
Maximum:
66.278
jan 1, 1961
At the date of observation
Value
Absolute change
Change from previous value
jan 1, 1961
66.278
+66.278
0.0%
jan 1, 1962
65.739
-0.539
-0.81%
jan 1, 1963
65.2
-0.539
-0.82%
jan 1, 1964
64.375
-0.825
-1.27%
jan 1, 1965
63.55
-0.825
-1.28%
jan 1, 1966
62.726
-0.825
-1.3%
jan 1, 1967
61.901
-0.825
-1.31%
jan 1, 1968
61.076
-0.825
-1.33%
jan 1, 1969
60.026
-1.05
-1.72%
jan 1, 1970
58.975
-1.05
-1.75%
jan 1, 1971
57.925
-1.05
-1.78%
jan 1, 1972
56.874
-1.05
-1.81%
jan 1, 1973
55.824
-1.05
-1.85%
jan 1, 1974
55.496
-0.328
-0.59%
jan 1, 1975
55.169
-0.328
-0.59%
jan 1, 1976
54.841
-0.328
-0.59%
jan 1, 1977
54.514
-0.328
-0.6%
jan 1, 1978
54.186
-0.328
-0.6%
jan 1, 1979
53.664
-0.522
-0.96%
jan 1, 1980
53.142
-0.522
-0.97%
jan 1, 1981
52.621
-0.522
-0.98%
jan 1, 1982
52.099
-0.522
-0.99%
jan 1, 1983
51.577
-0.522
-1.0%
jan 1, 1984
51.276
-0.301
-0.58%
jan 1, 1985
50.974
-0.301
-0.59%
jan 1, 1986
50.673
-0.301
-0.59%
jan 1, 1987
50.371
-0.301
-0.59%
jan 1, 1988
50.07
-0.301
-0.6%
jan 1, 1989
50.253
+0.183
0.37%
jan 1, 1990
50.436
+0.183
0.36%
jan 1, 1991
50.62
+0.183
0.36%
jan 1, 1992
50.803
+0.183
0.36%
jan 1, 1993
50.986
+0.183
0.36%
jan 1, 1994
50.601
-0.385
-0.75%
jan 1, 1995
50.216
-0.385
-0.76%
jan 1, 1996
49.832
-0.385
-0.77%
jan 1, 1997
49.447
-0.385
-0.77%
jan 1, 1998
49.062
-0.385
-0.78%
jan 1, 1999
50.024
+0.962
1.96%
jan 1, 2000
50.986
+0.962
1.92%
jan 1, 2001
51.948
+0.962
1.89%
jan 1, 2002
52.91
+0.962
1.85%
jan 1, 2003
53.872
+0.962
1.82%
jan 1, 2004
53.915
+0.043
0.08%
jan 1, 2005
53.958
+0.043
0.08%
jan 1, 2006
54.0
+0.043
0.08%
jan 1, 2007
54.043
+0.043
0.08%
jan 1, 2008
54.086
+0.043
0.08%
jan 1, 2009
54.668
+0.582
1.08%
jan 1, 2010
55.25
+0.582
1.06%
jan 1, 2011
55.833
+0.582
1.05%
jan 1, 2012
56.415
+0.582
1.04%
jan 1, 2013
56.997
+0.582
1.03%
jan 1, 2014
58.883
+1.886
3.31%
jan 1, 2015
60.768
+1.886
3.2%
jan 1, 2016
62.654
+1.886
3.1%
Ranking of countries by current statistics by years


Comments: