29
/
en
AIzaSyAYiBZKx7MnpbEhh9jyipgxe19OcubqV5w
April 1, 2024
186126
Malawi
MWI
true
2
1
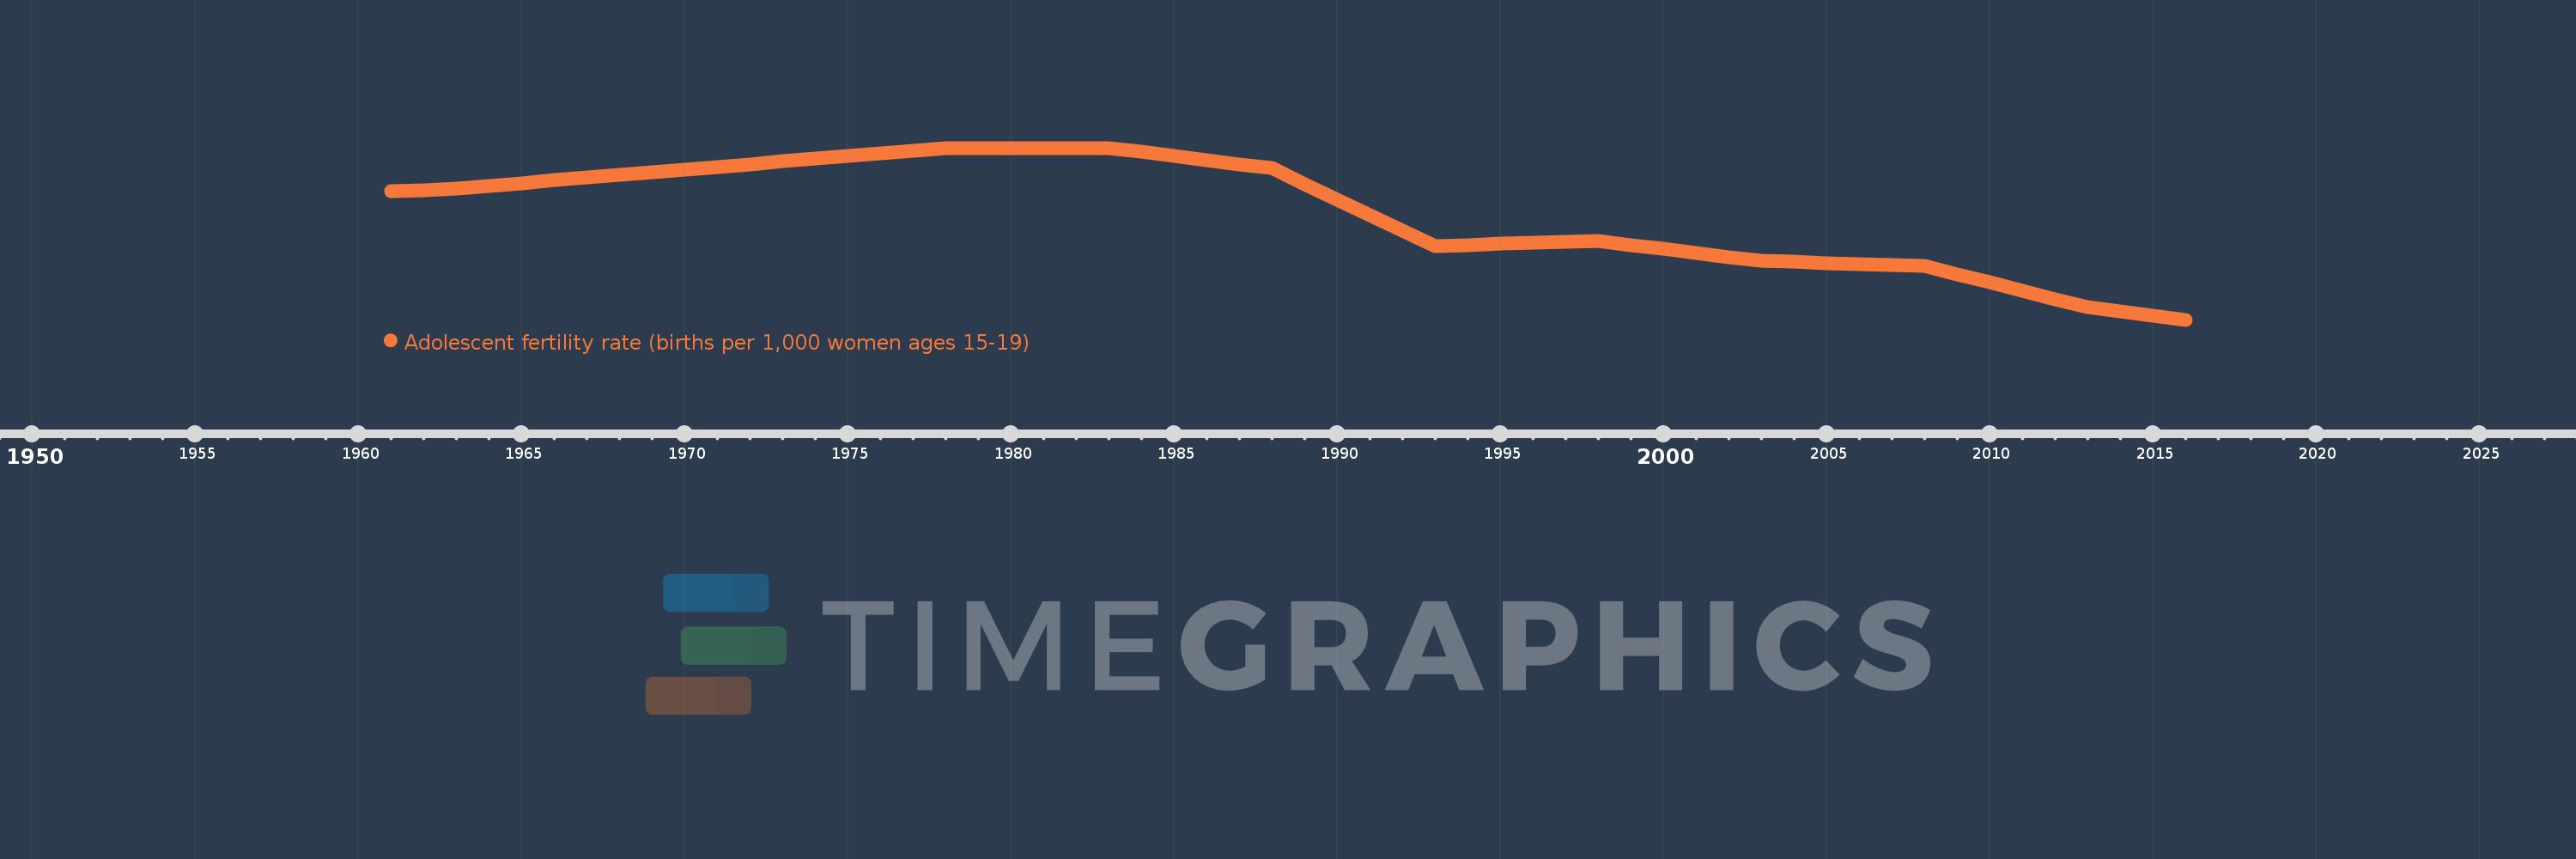
Adolescent fertility rate (births per 1,000 women ages 15-19)
2016,2015,2014,2013,2012,2011,2010,2009,2008,2007,2006,2005,2004,2003,2002,2001,2000,1999,1998,1997,1996,1995,1994,1993,1992,1991,1990,1989,1988,1987,1986,1985,1984,1983,1982,1981,1980,1979,1978,1977,1976,1975,1974,1973,1972,1971,1970,1969,1968,1967,1966,1965,1964,1963,1962,1961
This statistics in other country:
AfghanistanAlbaniaAlgeriaAngolaAntigua and BarbudaArab WorldArgentinaArmeniaArubaAustraliaAustriaAzerbaijanBahamas, TheBahrainBangladeshBarbadosBelarusBelgiumBelizeBeninBhutanBoliviaBosnia and HerzegovinaBotswanaBrazilBrunei DarussalamBulgariaBurkina FasoBurundiCabo VerdeCambodiaCameroonCanadaCaribbean small statesCentral African RepublicCentral Europe and the BalticsChadChannel IslandsChileChinaColombiaComorosCongo, Dem. Rep.Congo, Rep.Costa RicaCote d'IvoireCroatiaCubaCuracaoCyprusCzech RepublicDenmarkDjiboutiDominican RepublicEarly-demographic dividendEast Asia & PacificEast Asia & Pacific (excluding high income)East Asia & Pacific (IDA & IBRD countries)EcuadorEgypt, Arab Rep.El SalvadorEquatorial GuineaEritreaEstoniaEthiopiaEuro areaEurope & Central AsiaEurope & Central Asia (excluding high income)Europe & Central Asia (IDA & IBRD countries)European UnionFijiFinlandFragile and conflict affected situationsFranceFrench PolynesiaGabonGambia, TheGeorgiaGermanyGhanaGreeceGrenadaGuamGuatemalaGuineaGuinea-BissauGuyanaHaitiHeavily indebted poor countries (HIPC)High incomeHondurasHong Kong SAR, ChinaHungaryIBRD onlyIcelandIDA & IBRD totalIDA blendIDA onlyIDA totalIndiaIndonesiaIran, Islamic Rep.IraqIrelandIsraelItalyJamaicaJapanJordanKazakhstanKenyaKiribatiKorea, Dem. People’s Rep.Korea, Rep.KuwaitKyrgyz RepublicLao PDRLate-demographic dividendLatin America & Caribbean Latin America & Caribbean (excluding high income)Latin America & the Caribbean (IDA & IBRD countries)LatviaLeast developed countries: UN classificationLebanonLesothoLiberiaLibyaLithuaniaLow & middle incomeLow incomeLower middle incomeLuxembourgMacao SAR, ChinaMacedonia, FYRMadagascarMalawiMalaysiaMaldivesMaliMaltaMauritaniaMauritiusMexicoMicronesia, Fed. Sts.Middle East & North AfricaMiddle East & North Africa (excluding high income)Middle East & North Africa (IDA & IBRD countries)Middle incomeMoldovaMongoliaMontenegroMoroccoMozambiqueMyanmarNamibiaNepalNetherlandsNew CaledoniaNew ZealandNicaraguaNigerNigeriaNorth AmericaNorwayOECD membersOmanOther small statesPacific island small statesPakistanPanamaPapua New GuineaParaguayPeruPhilippinesPolandPortugalPost-demographic dividendPre-demographic dividendPuerto RicoQatarRomaniaRussian FederationRwandaSamoaSao Tome and PrincipeSaudi ArabiaSenegalSerbiaSeychellesSierra LeoneSingaporeSlovak RepublicSloveniaSmall statesSolomon IslandsSomaliaSouth AfricaSouth AsiaSouth Asia (IDA & IBRD)South SudanSpainSri LankaSt. LuciaSt. Vincent and the GrenadinesSub-Saharan Africa Sub-Saharan Africa (excluding high income)Sub-Saharan Africa (IDA & IBRD countries)SudanSurinameSwazilandSwedenSwitzerlandSyrian Arab RepublicTajikistanTanzaniaThailandTimor-LesteTogoTongaTrinidad and TobagoTunisiaTurkeyTurkmenistanUgandaUkraineUnited Arab EmiratesUnited KingdomUnited StatesUpper middle incomeUruguayUzbekistanVanuatuVenezuela, RBVietnamVirgin Islands (U.S.)West Bank and GazaWorldYemen, Rep.ZambiaZimbabwe Timeline:
This timeline shows a graph from 1961 to 2016 of Malawi. No data until 1960. Number of actual observations by date: 56.
Source name:
World Development Indicators
Source organization:
United Nations Population Division, World Population Prospects.
Categories, topics:
Health, Gender, Social Development
Last updated:
apr 23, 2017
Indicators value changes by year
Minimum:
135.349
jan 1, 2016
Maximum:
202.538
jan 1, 1978
At the date of observation
Value
Absolute change
Change from previous value
jan 1, 1961
185.541
+185.541
0.0%
jan 1, 1962
186.094
+0.553
0.3%
jan 1, 1963
186.647
+0.553
0.3%
jan 1, 1964
187.713
+1.066
0.57%
jan 1, 1965
188.78
+1.066
0.57%
jan 1, 1966
189.846
+1.066
0.56%
jan 1, 1967
190.913
+1.066
0.56%
jan 1, 1968
191.979
+1.066
0.56%
jan 1, 1969
193.035
+1.056
0.55%
jan 1, 1970
194.091
+1.056
0.55%
jan 1, 1971
195.147
+1.056
0.54%
jan 1, 1972
196.203
+1.056
0.54%
jan 1, 1973
197.259
+1.056
0.54%
jan 1, 1974
198.315
+1.056
0.54%
jan 1, 1975
199.371
+1.056
0.53%
jan 1, 1976
200.426
+1.056
0.53%
jan 1, 1977
201.482
+1.056
0.53%
jan 1, 1978
202.538
+1.056
0.52%
jan 1, 1979
202.538
0.0
0.0%
jan 1, 1980
202.538
0.0
0.0%
jan 1, 1981
202.538
0.0
0.0%
jan 1, 1982
202.538
0.0
0.0%
jan 1, 1983
202.538
0.0
0.0%
jan 1, 1984
200.939
-1.599
-0.79%
jan 1, 1985
199.34
-1.599
-0.8%
jan 1, 1986
197.741
-1.599
-0.8%
jan 1, 1987
196.142
-1.599
-0.81%
jan 1, 1988
194.543
-1.599
-0.82%
jan 1, 1989
188.483
-6.06
-3.11%
jan 1, 1990
182.424
-6.06
-3.21%
jan 1, 1991
176.364
-6.06
-3.32%
jan 1, 1992
170.305
-6.06
-3.44%
jan 1, 1993
164.245
-6.06
-3.56%
jan 1, 1994
164.615
+0.37
0.23%
jan 1, 1995
164.985
+0.37
0.22%
jan 1, 1996
165.354
+0.37
0.22%
jan 1, 1997
165.724
+0.37
0.22%
jan 1, 1998
166.094
+0.37
0.22%
jan 1, 1999
164.537
-1.557
-0.94%
jan 1, 2000
162.98
-1.557
-0.95%
jan 1, 2001
161.423
-1.557
-0.96%
jan 1, 2002
159.866
-1.557
-0.96%
jan 1, 2003
158.309
-1.557
-0.97%
jan 1, 2004
157.93
-0.379
-0.24%
jan 1, 2005
157.552
-0.379
-0.24%
jan 1, 2006
157.173
-0.379
-0.24%
jan 1, 2007
156.795
-0.379
-0.24%
jan 1, 2008
156.416
-0.379
-0.24%
jan 1, 2009
153.176
-3.24
-2.07%
jan 1, 2010
149.937
-3.24
-2.11%
jan 1, 2011
146.697
-3.24
-2.16%
jan 1, 2012
143.458
-3.24
-2.21%
jan 1, 2013
140.218
-3.24
-2.26%
jan 1, 2014
138.595
-1.623
-1.16%
jan 1, 2015
136.972
-1.623
-1.17%
jan 1, 2016
135.349
-1.623
-1.18%
Ranking of countries by current statistics by years


Comments: