29
/
en
AIzaSyAYiBZKx7MnpbEhh9jyipgxe19OcubqV5w
April 1, 2024
235326
Senegal
SEN
true
2
1
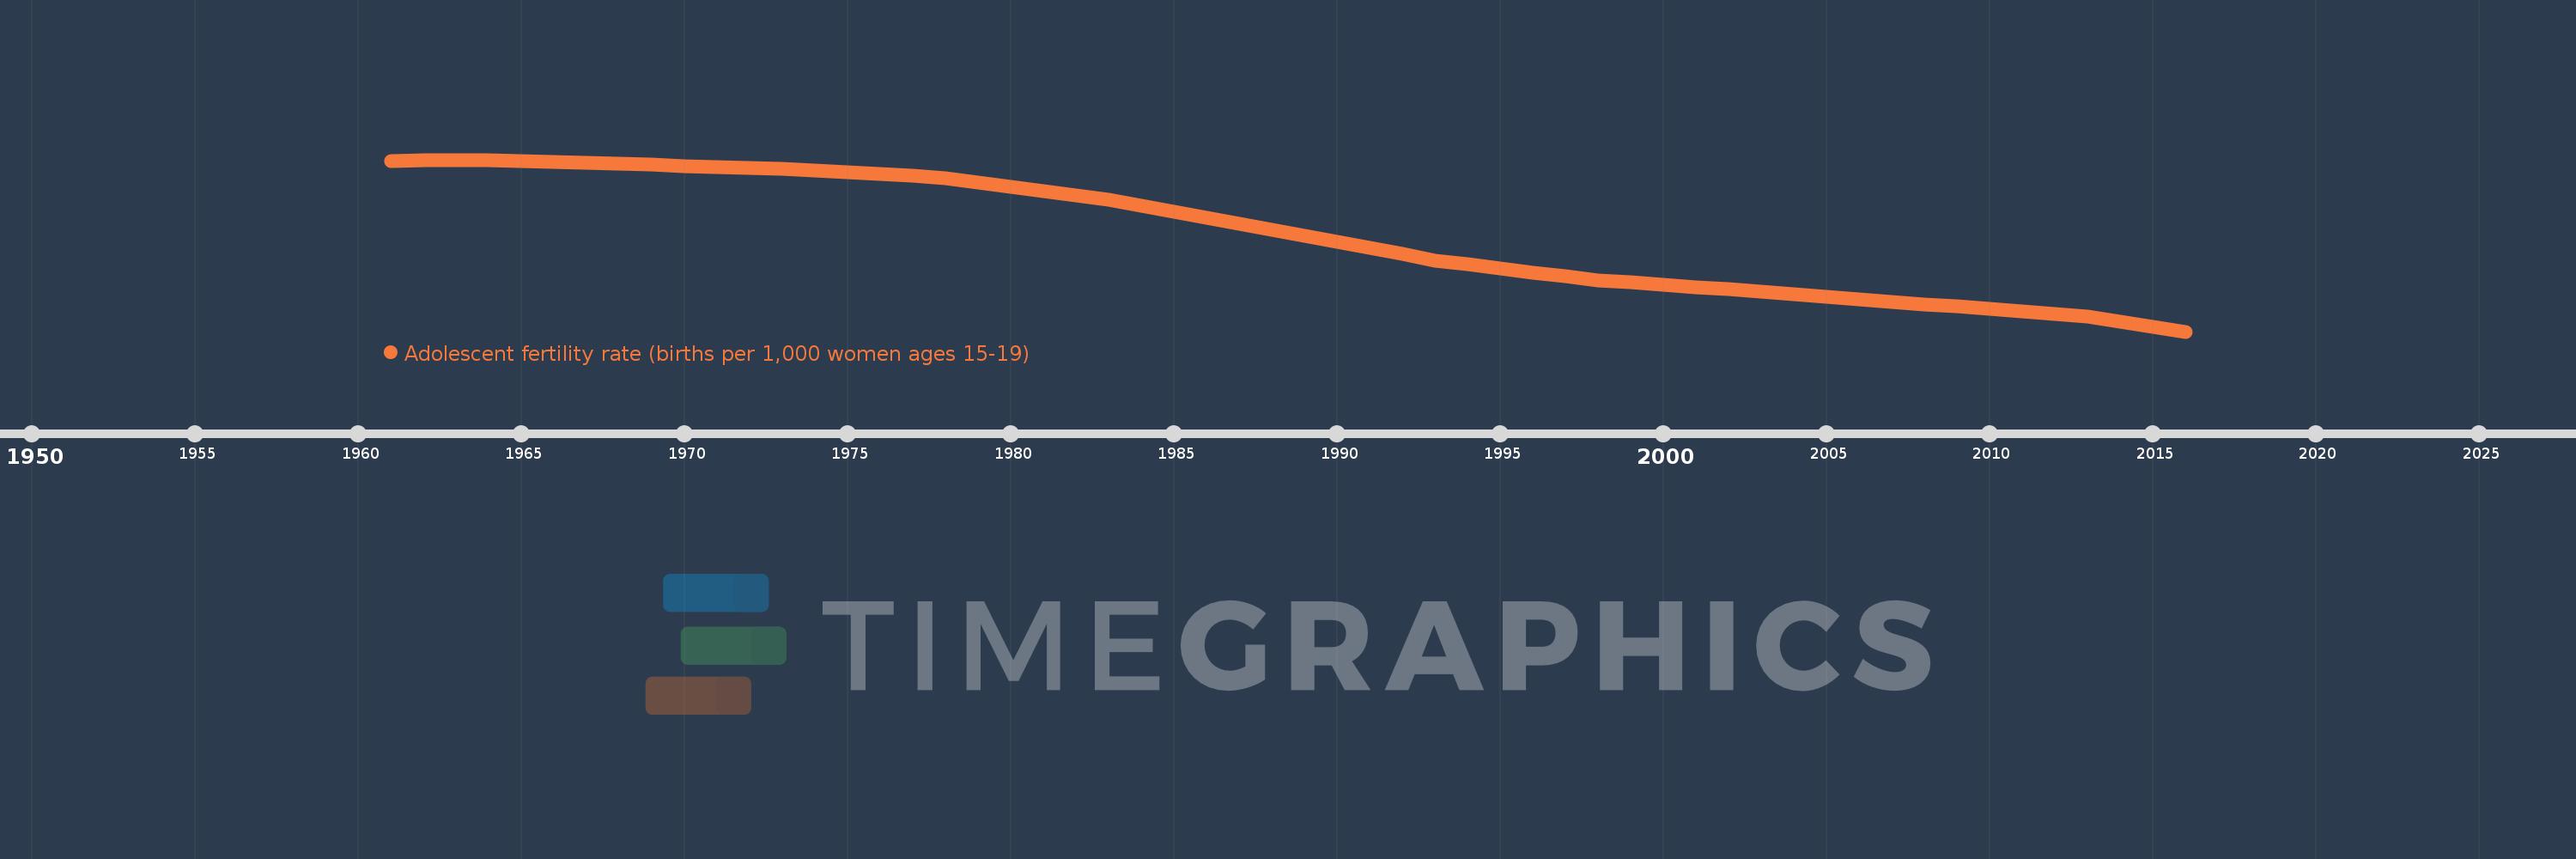
Adolescent fertility rate (births per 1,000 women ages 15-19)
2016,2015,2014,2013,2012,2011,2010,2009,2008,2007,2006,2005,2004,2003,2002,2001,2000,1999,1998,1997,1996,1995,1994,1993,1992,1991,1990,1989,1988,1987,1986,1985,1984,1983,1982,1981,1980,1979,1978,1977,1976,1975,1974,1973,1972,1971,1970,1969,1968,1967,1966,1965,1964,1963,1962,1961
This statistics in other country:
AfghanistanAlbaniaAlgeriaAngolaAntigua and BarbudaArab WorldArgentinaArmeniaArubaAustraliaAustriaAzerbaijanBahamas, TheBahrainBangladeshBarbadosBelarusBelgiumBelizeBeninBhutanBoliviaBosnia and HerzegovinaBotswanaBrazilBrunei DarussalamBulgariaBurkina FasoBurundiCabo VerdeCambodiaCameroonCanadaCaribbean small statesCentral African RepublicCentral Europe and the BalticsChadChannel IslandsChileChinaColombiaComorosCongo, Dem. Rep.Congo, Rep.Costa RicaCote d'IvoireCroatiaCubaCuracaoCyprusCzech RepublicDenmarkDjiboutiDominican RepublicEarly-demographic dividendEast Asia & PacificEast Asia & Pacific (excluding high income)East Asia & Pacific (IDA & IBRD countries)EcuadorEgypt, Arab Rep.El SalvadorEquatorial GuineaEritreaEstoniaEthiopiaEuro areaEurope & Central AsiaEurope & Central Asia (excluding high income)Europe & Central Asia (IDA & IBRD countries)European UnionFijiFinlandFragile and conflict affected situationsFranceFrench PolynesiaGabonGambia, TheGeorgiaGermanyGhanaGreeceGrenadaGuamGuatemalaGuineaGuinea-BissauGuyanaHaitiHeavily indebted poor countries (HIPC)High incomeHondurasHong Kong SAR, ChinaHungaryIBRD onlyIcelandIDA & IBRD totalIDA blendIDA onlyIDA totalIndiaIndonesiaIran, Islamic Rep.IraqIrelandIsraelItalyJamaicaJapanJordanKazakhstanKenyaKiribatiKorea, Dem. People’s Rep.Korea, Rep.KuwaitKyrgyz RepublicLao PDRLate-demographic dividendLatin America & Caribbean Latin America & Caribbean (excluding high income)Latin America & the Caribbean (IDA & IBRD countries)LatviaLeast developed countries: UN classificationLebanonLesothoLiberiaLibyaLithuaniaLow & middle incomeLow incomeLower middle incomeLuxembourgMacao SAR, ChinaMacedonia, FYRMadagascarMalawiMalaysiaMaldivesMaliMaltaMauritaniaMauritiusMexicoMicronesia, Fed. Sts.Middle East & North AfricaMiddle East & North Africa (excluding high income)Middle East & North Africa (IDA & IBRD countries)Middle incomeMoldovaMongoliaMontenegroMoroccoMozambiqueMyanmarNamibiaNepalNetherlandsNew CaledoniaNew ZealandNicaraguaNigerNigeriaNorth AmericaNorwayOECD membersOmanOther small statesPacific island small statesPakistanPanamaPapua New GuineaParaguayPeruPhilippinesPolandPortugalPost-demographic dividendPre-demographic dividendPuerto RicoQatarRomaniaRussian FederationRwandaSamoaSao Tome and PrincipeSaudi ArabiaSenegalSerbiaSeychellesSierra LeoneSingaporeSlovak RepublicSloveniaSmall statesSolomon IslandsSomaliaSouth AfricaSouth AsiaSouth Asia (IDA & IBRD)South SudanSpainSri LankaSt. LuciaSt. Vincent and the GrenadinesSub-Saharan Africa Sub-Saharan Africa (excluding high income)Sub-Saharan Africa (IDA & IBRD countries)SudanSurinameSwazilandSwedenSwitzerlandSyrian Arab RepublicTajikistanTanzaniaThailandTimor-LesteTogoTongaTrinidad and TobagoTunisiaTurkeyTurkmenistanUgandaUkraineUnited Arab EmiratesUnited KingdomUnited StatesUpper middle incomeUruguayUzbekistanVanuatuVenezuela, RBVietnamVirgin Islands (U.S.)West Bank and GazaWorldYemen, Rep.ZambiaZimbabwe Timeline:
This timeline shows a graph from 1961 to 2016 of Senegal. No data until 1960. Number of actual observations by date: 56.
Source name:
World Development Indicators
Source organization:
United Nations Population Division, World Population Prospects.
Categories, topics:
Health, Gender, Social Development
Last updated:
apr 23, 2017
Indicators value changes by year
Minimum:
76.877
jan 1, 2016
Maximum:
194.655
jan 1, 1963
At the date of observation
Value
Absolute change
Change from previous value
jan 1, 1961
193.682
+193.682
0.0%
jan 1, 1962
194.169
+0.486
0.25%
jan 1, 1963
194.655
+0.486
0.25%
jan 1, 1964
194.092
-0.563
-0.29%
jan 1, 1965
193.529
-0.563
-0.29%
jan 1, 1966
192.967
-0.563
-0.29%
jan 1, 1967
192.404
-0.563
-0.29%
jan 1, 1968
191.841
-0.563
-0.29%
jan 1, 1969
191.159
-0.682
-0.36%
jan 1, 1970
190.477
-0.682
-0.36%
jan 1, 1971
189.796
-0.682
-0.36%
jan 1, 1972
189.114
-0.682
-0.36%
jan 1, 1973
188.432
-0.682
-0.36%
jan 1, 1974
187.194
-1.238
-0.66%
jan 1, 1975
185.957
-1.238
-0.66%
jan 1, 1976
184.719
-1.238
-0.67%
jan 1, 1977
183.482
-1.238
-0.67%
jan 1, 1978
182.244
-1.238
-0.67%
jan 1, 1979
179.304
-2.94
-1.61%
jan 1, 1980
176.364
-2.94
-1.64%
jan 1, 1981
173.424
-2.94
-1.67%
jan 1, 1982
170.484
-2.94
-1.7%
jan 1, 1983
167.544
-2.94
-1.72%
jan 1, 1984
163.415
-4.129
-2.46%
jan 1, 1985
159.285
-4.129
-2.53%
jan 1, 1986
155.156
-4.129
-2.59%
jan 1, 1987
151.026
-4.129
-2.66%
jan 1, 1988
146.897
-4.129
-2.73%
jan 1, 1989
142.647
-4.25
-2.89%
jan 1, 1990
138.396
-4.25
-2.98%
jan 1, 1991
134.146
-4.25
-3.07%
jan 1, 1992
129.895
-4.25
-3.17%
jan 1, 1993
125.645
-4.25
-3.27%
jan 1, 1994
122.9
-2.745
-2.18%
jan 1, 1995
120.155
-2.745
-2.23%
jan 1, 1996
117.41
-2.745
-2.28%
jan 1, 1997
114.665
-2.745
-2.34%
jan 1, 1998
111.92
-2.745
-2.39%
jan 1, 1999
110.444
-1.476
-1.32%
jan 1, 2000
108.969
-1.476
-1.34%
jan 1, 2001
107.493
-1.476
-1.35%
jan 1, 2002
106.018
-1.476
-1.37%
jan 1, 2003
104.542
-1.476
-1.39%
jan 1, 2004
102.775
-1.767
-1.69%
jan 1, 2005
101.009
-1.767
-1.72%
jan 1, 2006
99.242
-1.767
-1.75%
jan 1, 2007
97.476
-1.767
-1.78%
jan 1, 2008
95.709
-1.767
-1.81%
jan 1, 2009
93.971
-1.738
-1.82%
jan 1, 2010
92.233
-1.738
-1.85%
jan 1, 2011
90.494
-1.738
-1.88%
jan 1, 2012
88.756
-1.738
-1.92%
jan 1, 2013
87.018
-1.738
-1.96%
jan 1, 2014
83.638
-3.38
-3.88%
jan 1, 2015
80.257
-3.38
-4.04%
jan 1, 2016
76.877
-3.38
-4.21%
Ranking of countries by current statistics by years


Comments: