29
/
en
AIzaSyAYiBZKx7MnpbEhh9jyipgxe19OcubqV5w
April 1, 2024
161178
Italy
ITA
true
2
1
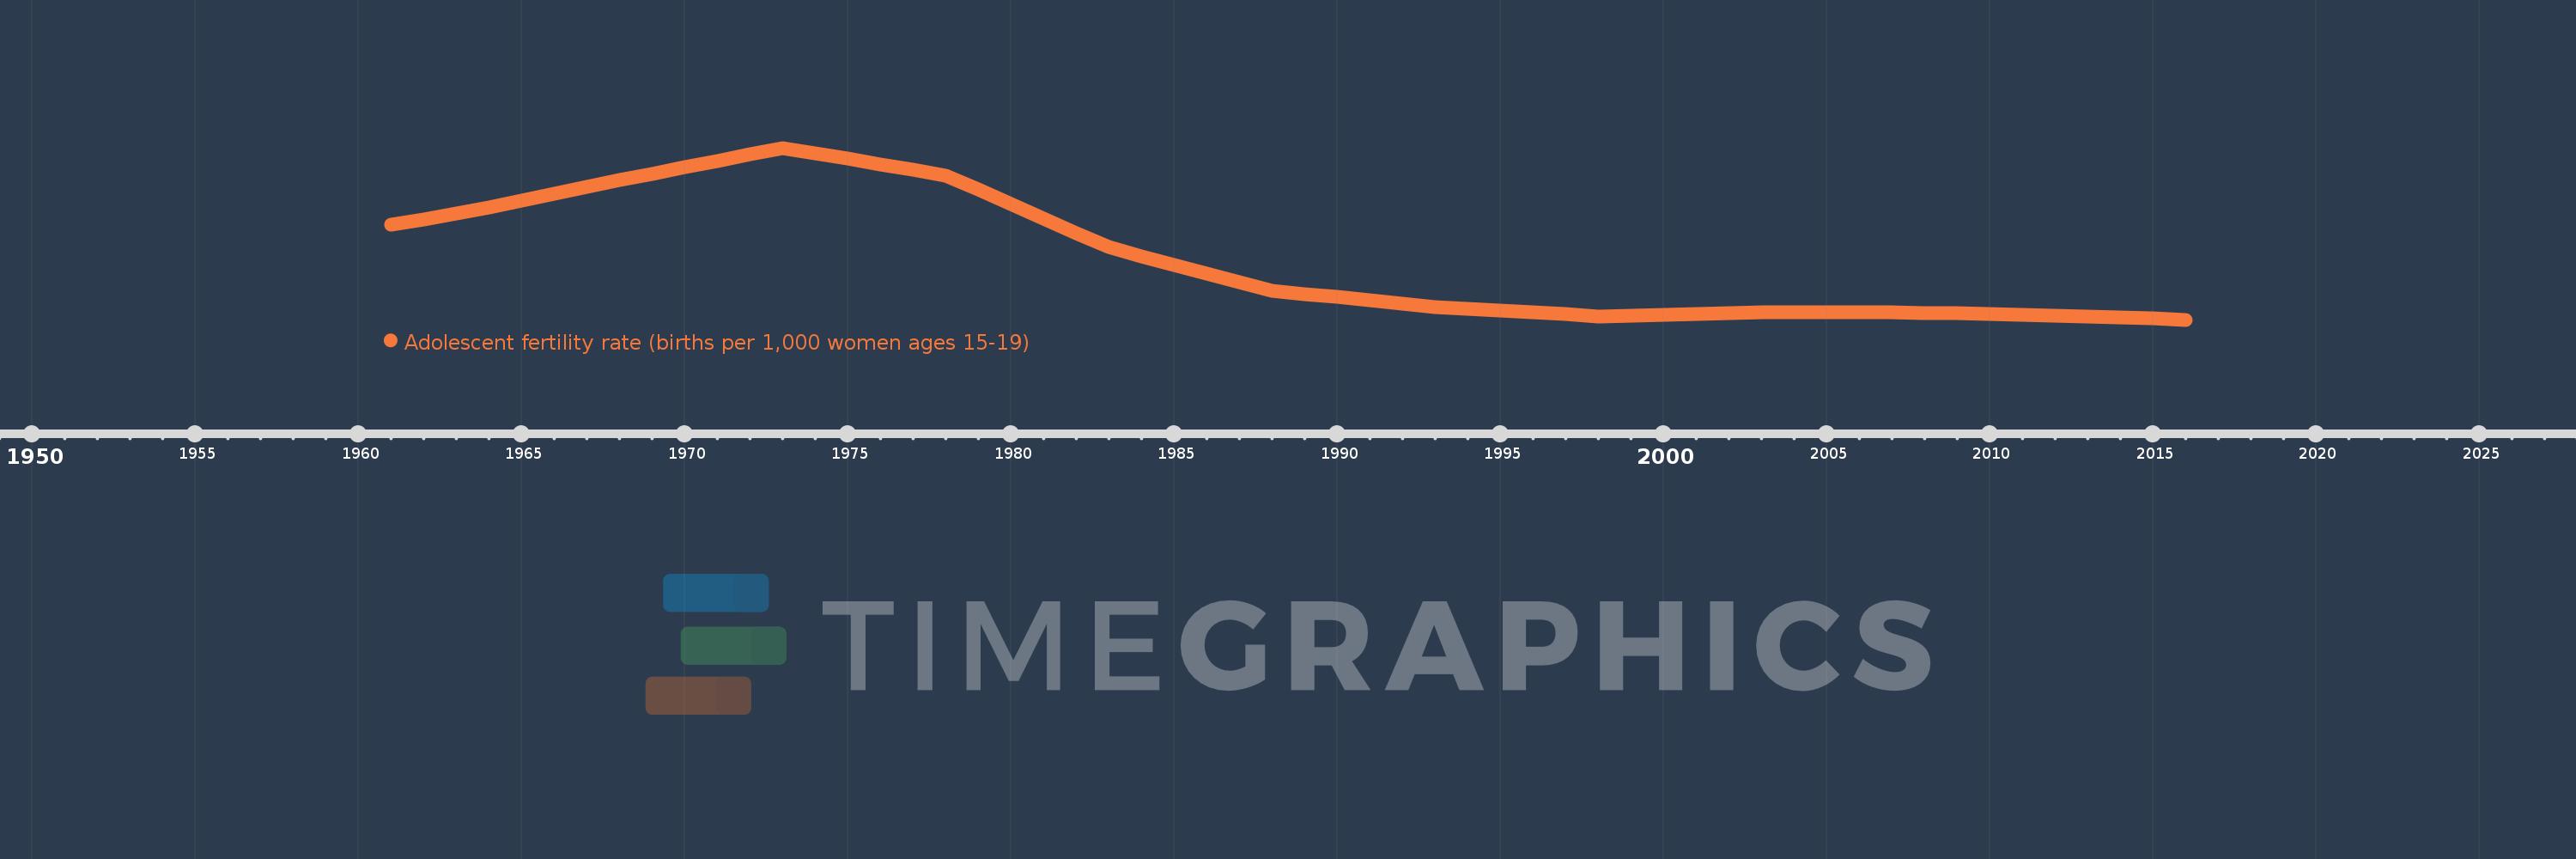
Adolescent fertility rate (births per 1,000 women ages 15-19)
2016,2015,2014,2013,2012,2011,2010,2009,2008,2007,2006,2005,2004,2003,2002,2001,2000,1999,1998,1997,1996,1995,1994,1993,1992,1991,1990,1989,1988,1987,1986,1985,1984,1983,1982,1981,1980,1979,1978,1977,1976,1975,1974,1973,1972,1971,1970,1969,1968,1967,1966,1965,1964,1963,1962,1961
This statistics in other country:
AfghanistanAlbaniaAlgeriaAngolaAntigua and BarbudaArab WorldArgentinaArmeniaArubaAustraliaAustriaAzerbaijanBahamas, TheBahrainBangladeshBarbadosBelarusBelgiumBelizeBeninBhutanBoliviaBosnia and HerzegovinaBotswanaBrazilBrunei DarussalamBulgariaBurkina FasoBurundiCabo VerdeCambodiaCameroonCanadaCaribbean small statesCentral African RepublicCentral Europe and the BalticsChadChannel IslandsChileChinaColombiaComorosCongo, Dem. Rep.Congo, Rep.Costa RicaCote d'IvoireCroatiaCubaCuracaoCyprusCzech RepublicDenmarkDjiboutiDominican RepublicEarly-demographic dividendEast Asia & PacificEast Asia & Pacific (excluding high income)East Asia & Pacific (IDA & IBRD countries)EcuadorEgypt, Arab Rep.El SalvadorEquatorial GuineaEritreaEstoniaEthiopiaEuro areaEurope & Central AsiaEurope & Central Asia (excluding high income)Europe & Central Asia (IDA & IBRD countries)European UnionFijiFinlandFragile and conflict affected situationsFranceFrench PolynesiaGabonGambia, TheGeorgiaGermanyGhanaGreeceGrenadaGuamGuatemalaGuineaGuinea-BissauGuyanaHaitiHeavily indebted poor countries (HIPC)High incomeHondurasHong Kong SAR, ChinaHungaryIBRD onlyIcelandIDA & IBRD totalIDA blendIDA onlyIDA totalIndiaIndonesiaIran, Islamic Rep.IraqIrelandIsraelItalyJamaicaJapanJordanKazakhstanKenyaKiribatiKorea, Dem. People’s Rep.Korea, Rep.KuwaitKyrgyz RepublicLao PDRLate-demographic dividendLatin America & Caribbean Latin America & Caribbean (excluding high income)Latin America & the Caribbean (IDA & IBRD countries)LatviaLeast developed countries: UN classificationLebanonLesothoLiberiaLibyaLithuaniaLow & middle incomeLow incomeLower middle incomeLuxembourgMacao SAR, ChinaMacedonia, FYRMadagascarMalawiMalaysiaMaldivesMaliMaltaMauritaniaMauritiusMexicoMicronesia, Fed. Sts.Middle East & North AfricaMiddle East & North Africa (excluding high income)Middle East & North Africa (IDA & IBRD countries)Middle incomeMoldovaMongoliaMontenegroMoroccoMozambiqueMyanmarNamibiaNepalNetherlandsNew CaledoniaNew ZealandNicaraguaNigerNigeriaNorth AmericaNorwayOECD membersOmanOther small statesPacific island small statesPakistanPanamaPapua New GuineaParaguayPeruPhilippinesPolandPortugalPost-demographic dividendPre-demographic dividendPuerto RicoQatarRomaniaRussian FederationRwandaSamoaSao Tome and PrincipeSaudi ArabiaSenegalSerbiaSeychellesSierra LeoneSingaporeSlovak RepublicSloveniaSmall statesSolomon IslandsSomaliaSouth AfricaSouth AsiaSouth Asia (IDA & IBRD)South SudanSpainSri LankaSt. LuciaSt. Vincent and the GrenadinesSub-Saharan Africa Sub-Saharan Africa (excluding high income)Sub-Saharan Africa (IDA & IBRD countries)SudanSurinameSwazilandSwedenSwitzerlandSyrian Arab RepublicTajikistanTanzaniaThailandTimor-LesteTogoTongaTrinidad and TobagoTunisiaTurkeyTurkmenistanUgandaUkraineUnited Arab EmiratesUnited KingdomUnited StatesUpper middle incomeUruguayUzbekistanVanuatuVenezuela, RBVietnamVirgin Islands (U.S.)West Bank and GazaWorldYemen, Rep.ZambiaZimbabwe Timeline:
This timeline shows a graph from 1961 to 2016 of Italy. No data until 1960. Number of actual observations by date: 56.
Source name:
World Development Indicators
Source organization:
United Nations Population Division, World Population Prospects.
Categories, topics:
Health, Gender, Social Development
Last updated:
apr 23, 2017
Indicators value changes by year
Maximum:
29.819
jan 1, 1973
At the date of observation
Value
Absolute change
Change from previous value
jan 1, 1961
19.192
+19.192
0.0%
jan 1, 1962
19.923
+0.73
3.81%
jan 1, 1963
20.653
+0.73
3.67%
jan 1, 1964
21.591
+0.938
4.54%
jan 1, 1965
22.529
+0.938
4.35%
jan 1, 1966
23.468
+0.938
4.16%
jan 1, 1967
24.406
+0.938
4.0%
jan 1, 1968
25.344
+0.938
3.84%
jan 1, 1969
26.239
+0.895
3.53%
jan 1, 1970
27.134
+0.895
3.41%
jan 1, 1971
28.029
+0.895
3.3%
jan 1, 1972
28.924
+0.895
3.19%
jan 1, 1973
29.819
+0.895
3.09%
jan 1, 1974
29.059
-0.76
-2.55%
jan 1, 1975
28.299
-0.76
-2.62%
jan 1, 1976
27.538
-0.76
-2.69%
jan 1, 1977
26.778
-0.76
-2.76%
jan 1, 1978
26.018
-0.76
-2.84%
jan 1, 1979
24.013
-2.005
-7.71%
jan 1, 1980
22.008
-2.005
-8.35%
jan 1, 1981
20.002
-2.005
-9.11%
jan 1, 1982
17.997
-2.005
-10.02%
jan 1, 1983
15.992
-2.005
-11.14%
jan 1, 1984
14.786
-1.206
-7.54%
jan 1, 1985
13.58
-1.206
-8.15%
jan 1, 1986
12.375
-1.206
-8.88%
jan 1, 1987
11.169
-1.206
-9.74%
jan 1, 1988
9.963
-1.206
-10.8%
jan 1, 1989
9.519
-0.444
-4.46%
jan 1, 1990
9.075
-0.444
-4.66%
jan 1, 1991
8.631
-0.444
-4.89%
jan 1, 1992
8.187
-0.444
-5.14%
jan 1, 1993
7.743
-0.444
-5.42%
jan 1, 1994
7.48
-0.263
-3.4%
jan 1, 1995
7.217
-0.263
-3.52%
jan 1, 1996
6.954
-0.263
-3.64%
jan 1, 1997
6.691
-0.263
-3.78%
jan 1, 1998
6.428
-0.263
-3.93%
jan 1, 1999
6.542
+0.114
1.77%
jan 1, 2000
6.656
+0.114
1.74%
jan 1, 2001
6.77
+0.114
1.71%
jan 1, 2002
6.884
+0.114
1.68%
jan 1, 2003
6.998
+0.114
1.66%
jan 1, 2004
6.98
-0.018
-0.26%
jan 1, 2005
6.961
-0.018
-0.26%
jan 1, 2006
6.943
-0.018
-0.26%
jan 1, 2007
6.924
-0.018
-0.27%
jan 1, 2008
6.906
-0.018
-0.27%
jan 1, 2009
6.801
-0.105
-1.52%
jan 1, 2010
6.696
-0.105
-1.54%
jan 1, 2011
6.591
-0.105
-1.57%
jan 1, 2012
6.486
-0.105
-1.59%
jan 1, 2013
6.381
-0.105
-1.62%
jan 1, 2014
6.232
-0.149
-2.33%
jan 1, 2015
6.084
-0.149
-2.38%
jan 1, 2016
5.935
-0.149
-2.44%
Ranking of countries by current statistics by years


Comments: