29
/
en
AIzaSyAYiBZKx7MnpbEhh9jyipgxe19OcubqV5w
April 1, 2024
148794
Haiti
HTI
true
2
1
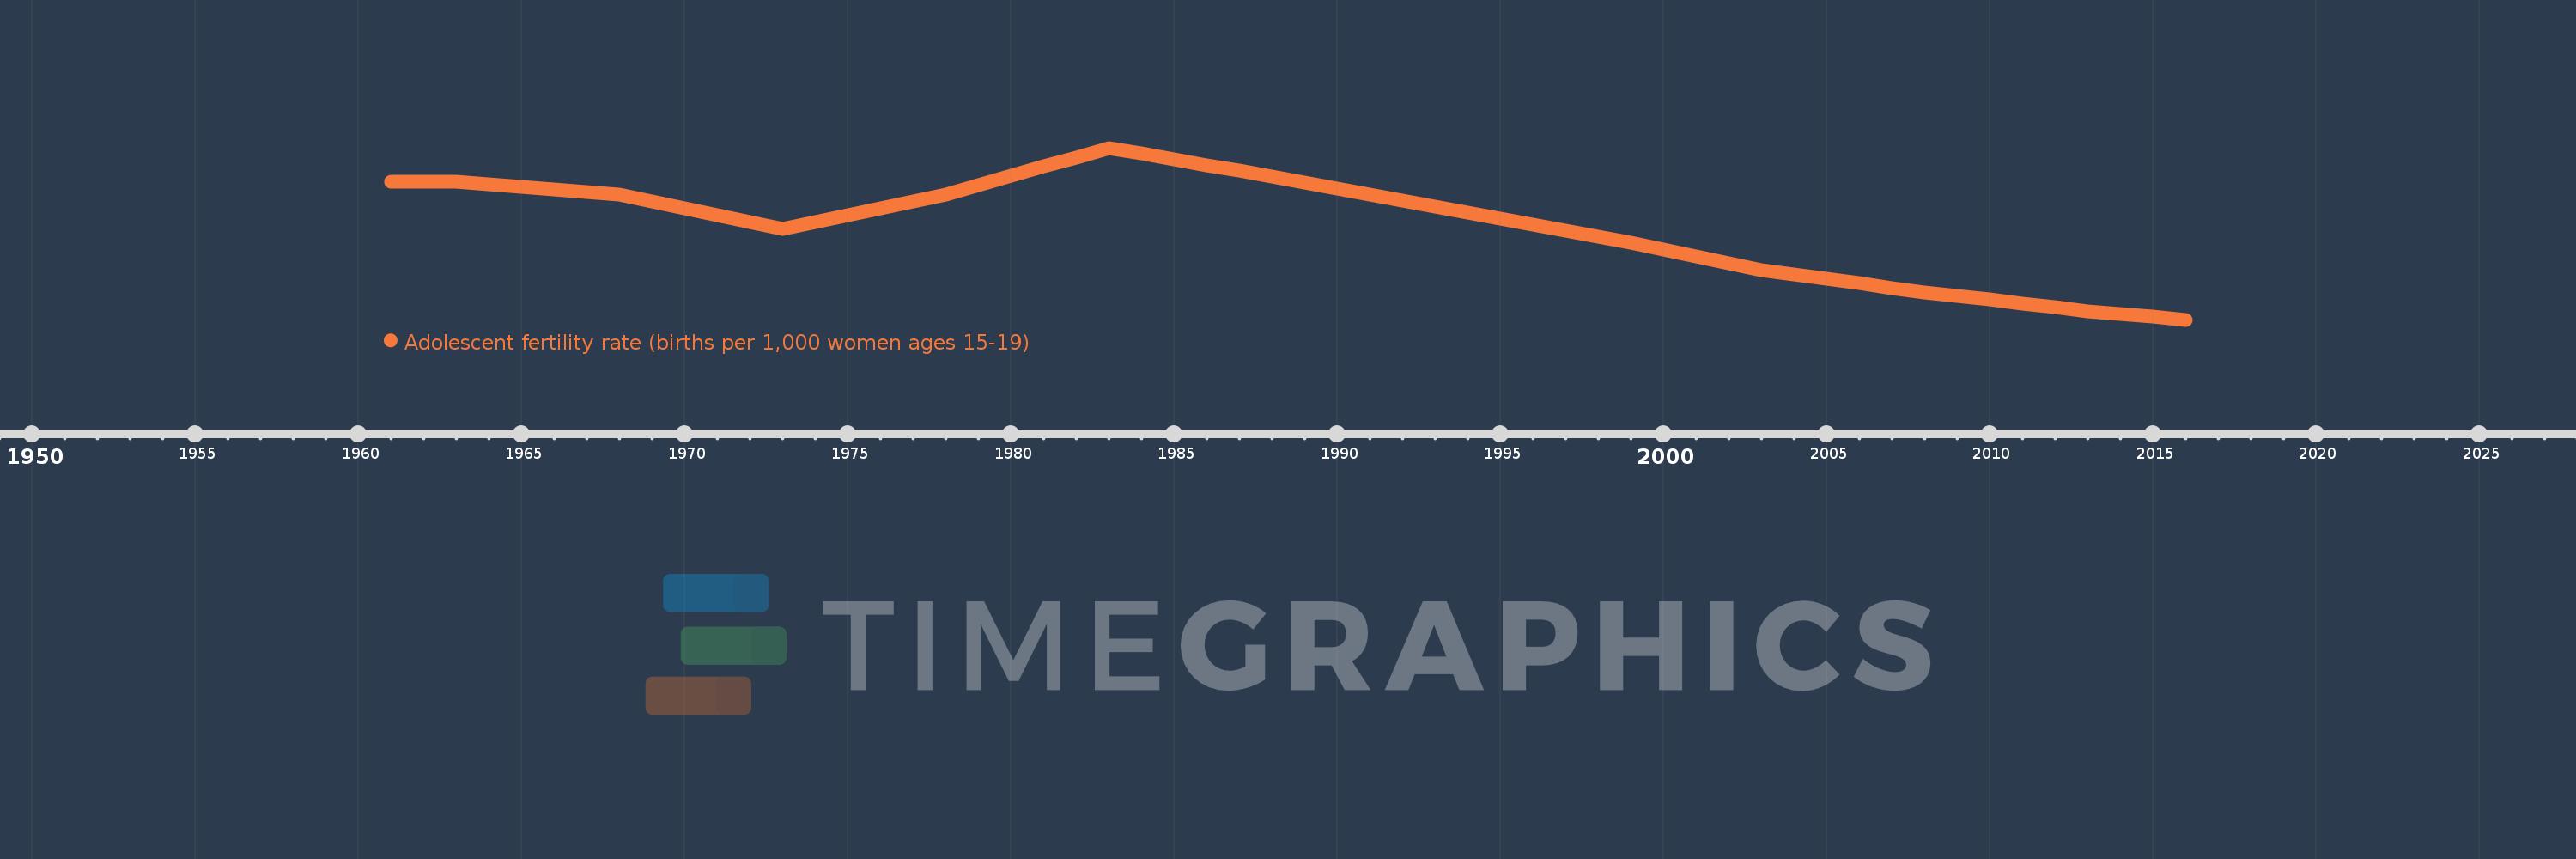
Adolescent fertility rate (births per 1,000 women ages 15-19)
2016,2015,2014,2013,2012,2011,2010,2009,2008,2007,2006,2005,2004,2003,2002,2001,2000,1999,1998,1997,1996,1995,1994,1993,1992,1991,1990,1989,1988,1987,1986,1985,1984,1983,1982,1981,1980,1979,1978,1977,1976,1975,1974,1973,1972,1971,1970,1969,1968,1967,1966,1965,1964,1963,1962,1961
This statistics in other country:
AfghanistanAlbaniaAlgeriaAngolaAntigua and BarbudaArab WorldArgentinaArmeniaArubaAustraliaAustriaAzerbaijanBahamas, TheBahrainBangladeshBarbadosBelarusBelgiumBelizeBeninBhutanBoliviaBosnia and HerzegovinaBotswanaBrazilBrunei DarussalamBulgariaBurkina FasoBurundiCabo VerdeCambodiaCameroonCanadaCaribbean small statesCentral African RepublicCentral Europe and the BalticsChadChannel IslandsChileChinaColombiaComorosCongo, Dem. Rep.Congo, Rep.Costa RicaCote d'IvoireCroatiaCubaCuracaoCyprusCzech RepublicDenmarkDjiboutiDominican RepublicEarly-demographic dividendEast Asia & PacificEast Asia & Pacific (excluding high income)East Asia & Pacific (IDA & IBRD countries)EcuadorEgypt, Arab Rep.El SalvadorEquatorial GuineaEritreaEstoniaEthiopiaEuro areaEurope & Central AsiaEurope & Central Asia (excluding high income)Europe & Central Asia (IDA & IBRD countries)European UnionFijiFinlandFragile and conflict affected situationsFranceFrench PolynesiaGabonGambia, TheGeorgiaGermanyGhanaGreeceGrenadaGuamGuatemalaGuineaGuinea-BissauGuyanaHaitiHeavily indebted poor countries (HIPC)High incomeHondurasHong Kong SAR, ChinaHungaryIBRD onlyIcelandIDA & IBRD totalIDA blendIDA onlyIDA totalIndiaIndonesiaIran, Islamic Rep.IraqIrelandIsraelItalyJamaicaJapanJordanKazakhstanKenyaKiribatiKorea, Dem. People’s Rep.Korea, Rep.KuwaitKyrgyz RepublicLao PDRLate-demographic dividendLatin America & Caribbean Latin America & Caribbean (excluding high income)Latin America & the Caribbean (IDA & IBRD countries)LatviaLeast developed countries: UN classificationLebanonLesothoLiberiaLibyaLithuaniaLow & middle incomeLow incomeLower middle incomeLuxembourgMacao SAR, ChinaMacedonia, FYRMadagascarMalawiMalaysiaMaldivesMaliMaltaMauritaniaMauritiusMexicoMicronesia, Fed. Sts.Middle East & North AfricaMiddle East & North Africa (excluding high income)Middle East & North Africa (IDA & IBRD countries)Middle incomeMoldovaMongoliaMontenegroMoroccoMozambiqueMyanmarNamibiaNepalNetherlandsNew CaledoniaNew ZealandNicaraguaNigerNigeriaNorth AmericaNorwayOECD membersOmanOther small statesPacific island small statesPakistanPanamaPapua New GuineaParaguayPeruPhilippinesPolandPortugalPost-demographic dividendPre-demographic dividendPuerto RicoQatarRomaniaRussian FederationRwandaSamoaSao Tome and PrincipeSaudi ArabiaSenegalSerbiaSeychellesSierra LeoneSingaporeSlovak RepublicSloveniaSmall statesSolomon IslandsSomaliaSouth AfricaSouth AsiaSouth Asia (IDA & IBRD)South SudanSpainSri LankaSt. LuciaSt. Vincent and the GrenadinesSub-Saharan Africa Sub-Saharan Africa (excluding high income)Sub-Saharan Africa (IDA & IBRD countries)SudanSurinameSwazilandSwedenSwitzerlandSyrian Arab RepublicTajikistanTanzaniaThailandTimor-LesteTogoTongaTrinidad and TobagoTunisiaTurkeyTurkmenistanUgandaUkraineUnited Arab EmiratesUnited KingdomUnited StatesUpper middle incomeUruguayUzbekistanVanuatuVenezuela, RBVietnamVirgin Islands (U.S.)West Bank and GazaWorldYemen, Rep.ZambiaZimbabwe Timeline:
This timeline shows a graph from 1961 to 2016 of Haiti. No data until 1960. Number of actual observations by date: 56.
Source name:
World Development Indicators
Source organization:
United Nations Population Division, World Population Prospects.
Categories, topics:
Health, Gender, Social Development
Last updated:
apr 23, 2017
Indicators value changes by year
Maximum:
86.082
jan 1, 1983
At the date of observation
Value
Absolute change
Change from previous value
jan 1, 1961
76.798
+76.798
0.0%
jan 1, 1962
76.798
0.0
0.0%
jan 1, 1963
76.798
0.0
0.0%
jan 1, 1964
76.078
-0.72
-0.94%
jan 1, 1965
75.359
-0.72
-0.95%
jan 1, 1966
74.639
-0.72
-0.95%
jan 1, 1967
73.92
-0.72
-0.96%
jan 1, 1968
73.2
-0.72
-0.97%
jan 1, 1969
71.34
-1.86
-2.54%
jan 1, 1970
69.481
-1.86
-2.61%
jan 1, 1971
67.621
-1.86
-2.68%
jan 1, 1972
65.762
-1.86
-2.75%
jan 1, 1973
63.902
-1.86
-2.83%
jan 1, 1974
65.78
+1.878
2.94%
jan 1, 1975
67.657
+1.878
2.85%
jan 1, 1976
69.535
+1.878
2.78%
jan 1, 1977
71.412
+1.878
2.7%
jan 1, 1978
73.29
+1.878
2.63%
jan 1, 1979
75.848
+2.558
3.49%
jan 1, 1980
78.407
+2.558
3.37%
jan 1, 1981
80.965
+2.558
3.26%
jan 1, 1982
83.524
+2.558
3.16%
jan 1, 1983
86.082
+2.558
3.06%
jan 1, 1984
84.524
-1.558
-1.81%
jan 1, 1985
82.966
-1.558
-1.84%
jan 1, 1986
81.408
-1.558
-1.88%
jan 1, 1987
79.85
-1.558
-1.91%
jan 1, 1988
78.292
-1.558
-1.95%
jan 1, 1989
76.612
-1.68
-2.15%
jan 1, 1990
74.933
-1.68
-2.19%
jan 1, 1991
73.253
-1.68
-2.24%
jan 1, 1992
71.574
-1.68
-2.29%
jan 1, 1993
69.894
-1.68
-2.35%
jan 1, 1994
68.274
-1.62
-2.32%
jan 1, 1995
66.655
-1.62
-2.37%
jan 1, 1996
65.035
-1.62
-2.43%
jan 1, 1997
63.416
-1.62
-2.49%
jan 1, 1998
61.796
-1.62
-2.55%
jan 1, 1999
59.933
-1.863
-3.01%
jan 1, 2000
58.07
-1.863
-3.11%
jan 1, 2001
56.208
-1.863
-3.21%
jan 1, 2002
54.345
-1.863
-3.31%
jan 1, 2003
52.482
-1.863
-3.43%
jan 1, 2004
51.273
-1.209
-2.3%
jan 1, 2005
50.065
-1.209
-2.36%
jan 1, 2006
48.856
-1.209
-2.41%
jan 1, 2007
47.648
-1.209
-2.47%
jan 1, 2008
46.439
-1.209
-2.54%
jan 1, 2009
45.404
-1.035
-2.23%
jan 1, 2010
44.369
-1.035
-2.28%
jan 1, 2011
43.335
-1.035
-2.33%
jan 1, 2012
42.3
-1.035
-2.39%
jan 1, 2013
41.265
-1.035
-2.45%
jan 1, 2014
40.47
-0.795
-1.93%
jan 1, 2015
39.675
-0.795
-1.96%
jan 1, 2016
38.88
-0.795
-2.0%
Ranking of countries by current statistics by years


Comments: