29
/
en
AIzaSyAYiBZKx7MnpbEhh9jyipgxe19OcubqV5w
April 1, 2024
228078
Romania
ROU
true
2
1
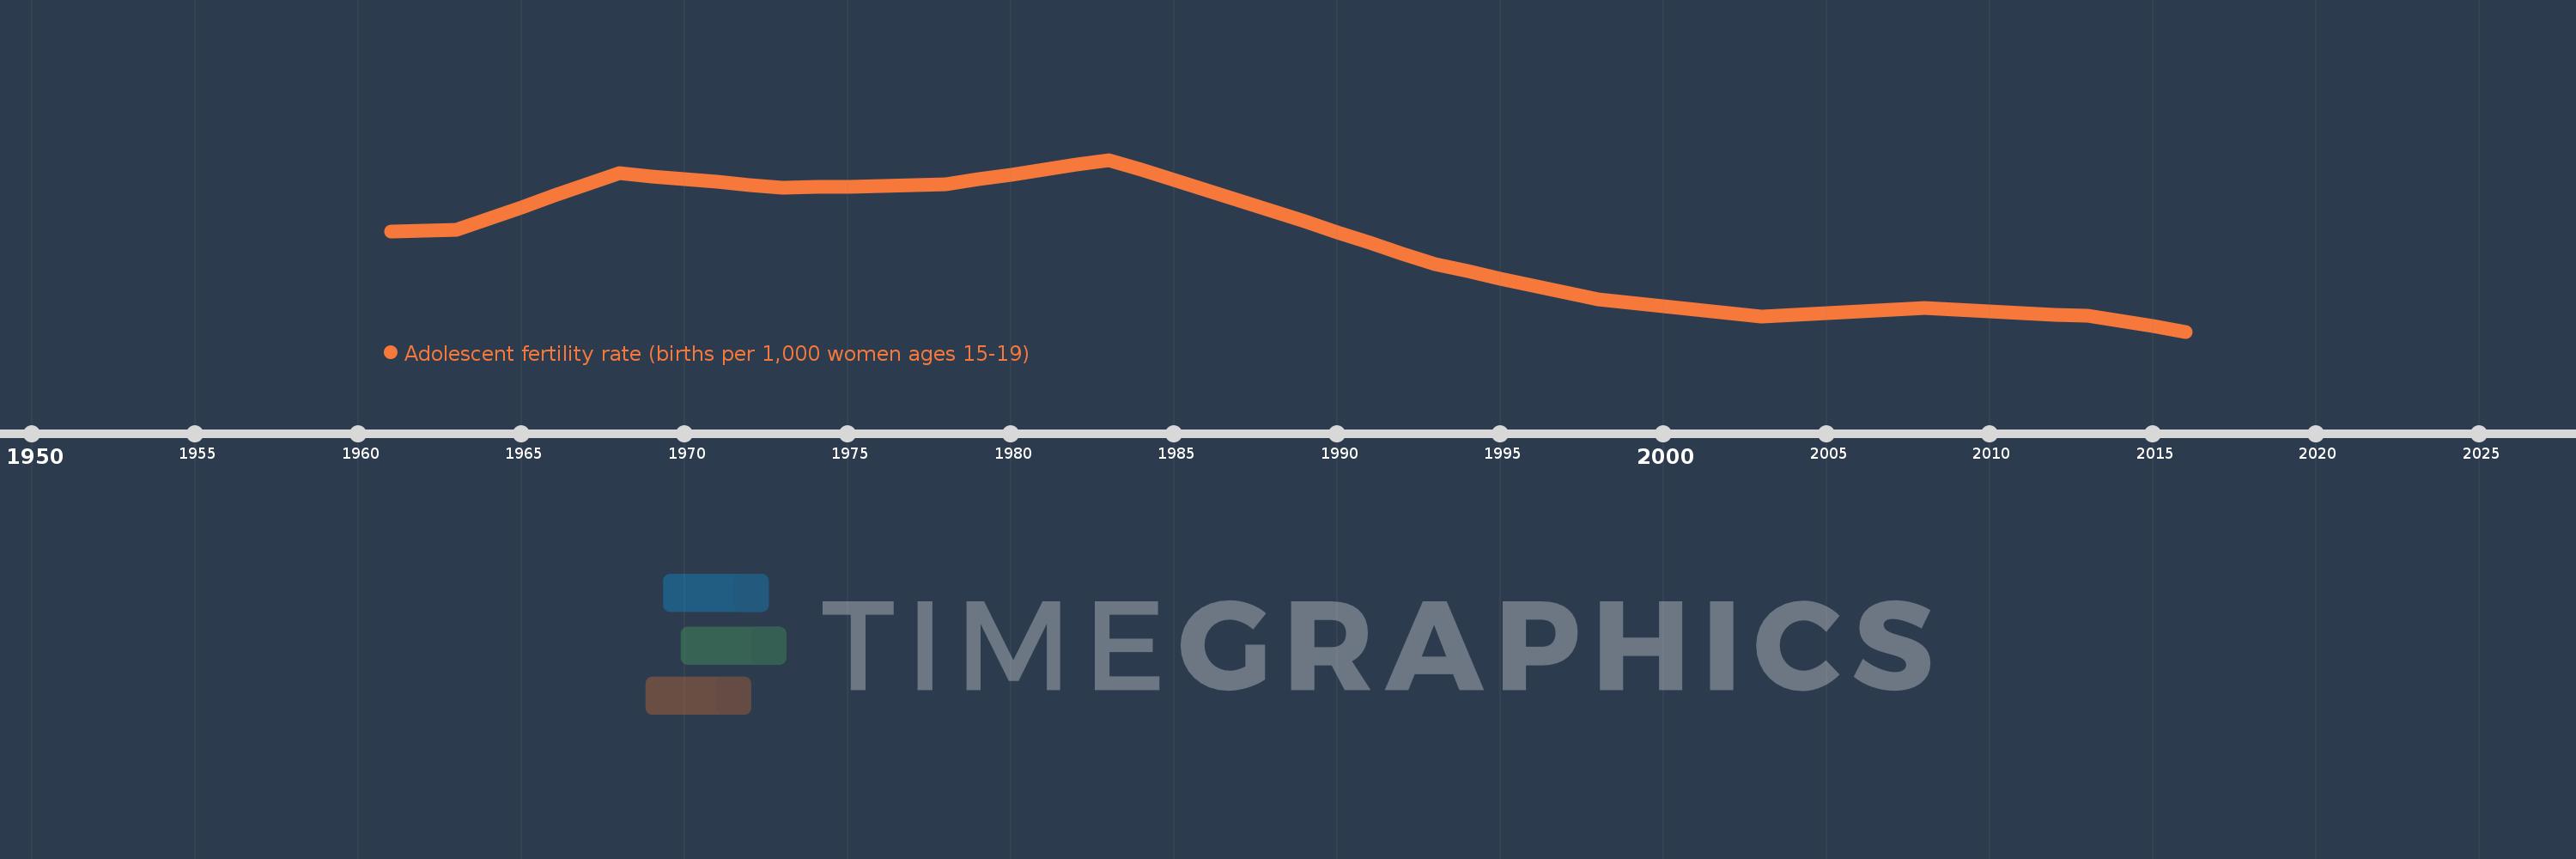
Adolescent fertility rate (births per 1,000 women ages 15-19)
2016,2015,2014,2013,2012,2011,2010,2009,2008,2007,2006,2005,2004,2003,2002,2001,2000,1999,1998,1997,1996,1995,1994,1993,1992,1991,1990,1989,1988,1987,1986,1985,1984,1983,1982,1981,1980,1979,1978,1977,1976,1975,1974,1973,1972,1971,1970,1969,1968,1967,1966,1965,1964,1963,1962,1961
This statistics in other country:
AfghanistanAlbaniaAlgeriaAngolaAntigua and BarbudaArab WorldArgentinaArmeniaArubaAustraliaAustriaAzerbaijanBahamas, TheBahrainBangladeshBarbadosBelarusBelgiumBelizeBeninBhutanBoliviaBosnia and HerzegovinaBotswanaBrazilBrunei DarussalamBulgariaBurkina FasoBurundiCabo VerdeCambodiaCameroonCanadaCaribbean small statesCentral African RepublicCentral Europe and the BalticsChadChannel IslandsChileChinaColombiaComorosCongo, Dem. Rep.Congo, Rep.Costa RicaCote d'IvoireCroatiaCubaCuracaoCyprusCzech RepublicDenmarkDjiboutiDominican RepublicEarly-demographic dividendEast Asia & PacificEast Asia & Pacific (excluding high income)East Asia & Pacific (IDA & IBRD countries)EcuadorEgypt, Arab Rep.El SalvadorEquatorial GuineaEritreaEstoniaEthiopiaEuro areaEurope & Central AsiaEurope & Central Asia (excluding high income)Europe & Central Asia (IDA & IBRD countries)European UnionFijiFinlandFragile and conflict affected situationsFranceFrench PolynesiaGabonGambia, TheGeorgiaGermanyGhanaGreeceGrenadaGuamGuatemalaGuineaGuinea-BissauGuyanaHaitiHeavily indebted poor countries (HIPC)High incomeHondurasHong Kong SAR, ChinaHungaryIBRD onlyIcelandIDA & IBRD totalIDA blendIDA onlyIDA totalIndiaIndonesiaIran, Islamic Rep.IraqIrelandIsraelItalyJamaicaJapanJordanKazakhstanKenyaKiribatiKorea, Dem. People’s Rep.Korea, Rep.KuwaitKyrgyz RepublicLao PDRLate-demographic dividendLatin America & Caribbean Latin America & Caribbean (excluding high income)Latin America & the Caribbean (IDA & IBRD countries)LatviaLeast developed countries: UN classificationLebanonLesothoLiberiaLibyaLithuaniaLow & middle incomeLow incomeLower middle incomeLuxembourgMacao SAR, ChinaMacedonia, FYRMadagascarMalawiMalaysiaMaldivesMaliMaltaMauritaniaMauritiusMexicoMicronesia, Fed. Sts.Middle East & North AfricaMiddle East & North Africa (excluding high income)Middle East & North Africa (IDA & IBRD countries)Middle incomeMoldovaMongoliaMontenegroMoroccoMozambiqueMyanmarNamibiaNepalNetherlandsNew CaledoniaNew ZealandNicaraguaNigerNigeriaNorth AmericaNorwayOECD membersOmanOther small statesPacific island small statesPakistanPanamaPapua New GuineaParaguayPeruPhilippinesPolandPortugalPost-demographic dividendPre-demographic dividendPuerto RicoQatarRomaniaRussian FederationRwandaSamoaSao Tome and PrincipeSaudi ArabiaSenegalSerbiaSeychellesSierra LeoneSingaporeSlovak RepublicSloveniaSmall statesSolomon IslandsSomaliaSouth AfricaSouth AsiaSouth Asia (IDA & IBRD)South SudanSpainSri LankaSt. LuciaSt. Vincent and the GrenadinesSub-Saharan Africa Sub-Saharan Africa (excluding high income)Sub-Saharan Africa (IDA & IBRD countries)SudanSurinameSwazilandSwedenSwitzerlandSyrian Arab RepublicTajikistanTanzaniaThailandTimor-LesteTogoTongaTrinidad and TobagoTunisiaTurkeyTurkmenistanUgandaUkraineUnited Arab EmiratesUnited KingdomUnited StatesUpper middle incomeUruguayUzbekistanVanuatuVenezuela, RBVietnamVirgin Islands (U.S.)West Bank and GazaWorldYemen, Rep.ZambiaZimbabwe Timeline:
This timeline shows a graph from 1961 to 2016 of Romania. No data until 1960. Number of actual observations by date: 56.
Source name:
World Development Indicators
Source organization:
United Nations Population Division, World Population Prospects.
Categories, topics:
Health, Gender, Social Development
Last updated:
apr 23, 2017
Indicators value changes by year
Minimum:
34.034
jan 1, 2016
Maximum:
70.215
jan 1, 1983
At the date of observation
Value
Absolute change
Change from previous value
jan 1, 1961
55.08
+55.08
0.0%
jan 1, 1962
55.304
+0.223
0.41%
jan 1, 1963
55.527
+0.223
0.4%
jan 1, 1964
57.891
+2.364
4.26%
jan 1, 1965
60.255
+2.364
4.08%
jan 1, 1966
62.619
+2.364
3.92%
jan 1, 1967
64.983
+2.364
3.78%
jan 1, 1968
67.347
+2.364
3.64%
jan 1, 1969
66.738
-0.609
-0.9%
jan 1, 1970
66.13
-0.609
-0.91%
jan 1, 1971
65.521
-0.609
-0.92%
jan 1, 1972
64.913
-0.609
-0.93%
jan 1, 1973
64.304
-0.609
-0.94%
jan 1, 1974
64.455
+0.151
0.23%
jan 1, 1975
64.606
+0.151
0.23%
jan 1, 1976
64.757
+0.151
0.23%
jan 1, 1977
64.908
+0.151
0.23%
jan 1, 1978
65.059
+0.151
0.23%
jan 1, 1979
66.09
+1.031
1.59%
jan 1, 1980
67.121
+1.031
1.56%
jan 1, 1981
68.153
+1.031
1.54%
jan 1, 1982
69.184
+1.031
1.51%
jan 1, 1983
70.215
+1.031
1.49%
jan 1, 1984
68.063
-2.152
-3.07%
jan 1, 1985
65.91
-2.152
-3.16%
jan 1, 1986
63.758
-2.152
-3.27%
jan 1, 1987
61.605
-2.152
-3.38%
jan 1, 1988
59.453
-2.152
-3.49%
jan 1, 1989
57.196
-2.257
-3.8%
jan 1, 1990
54.939
-2.257
-3.95%
jan 1, 1991
52.682
-2.257
-4.11%
jan 1, 1992
50.425
-2.257
-4.28%
jan 1, 1993
48.168
-2.257
-4.48%
jan 1, 1994
46.699
-1.469
-3.05%
jan 1, 1995
45.23
-1.469
-3.15%
jan 1, 1996
43.76
-1.469
-3.25%
jan 1, 1997
42.291
-1.469
-3.36%
jan 1, 1998
40.822
-1.469
-3.47%
jan 1, 1999
40.092
-0.73
-1.79%
jan 1, 2000
39.362
-0.73
-1.82%
jan 1, 2001
38.631
-0.73
-1.86%
jan 1, 2002
37.901
-0.73
-1.89%
jan 1, 2003
37.171
-0.73
-1.93%
jan 1, 2004
37.55
+0.379
1.02%
jan 1, 2005
37.929
+0.379
1.01%
jan 1, 2006
38.307
+0.379
1.0%
jan 1, 2007
38.686
+0.379
0.99%
jan 1, 2008
39.065
+0.379
0.98%
jan 1, 2009
38.71
-0.355
-0.91%
jan 1, 2010
38.356
-0.355
-0.92%
jan 1, 2011
38.001
-0.355
-0.92%
jan 1, 2012
37.647
-0.355
-0.93%
jan 1, 2013
37.292
-0.355
-0.94%
jan 1, 2014
36.206
-1.086
-2.91%
jan 1, 2015
35.12
-1.086
-3.0%
jan 1, 2016
34.034
-1.086
-3.09%
Ranking of countries by current statistics by years


Comments: