29
/
en
AIzaSyAYiBZKx7MnpbEhh9jyipgxe19OcubqV5w
April 1, 2024
276352
United States
USA
true
2
1
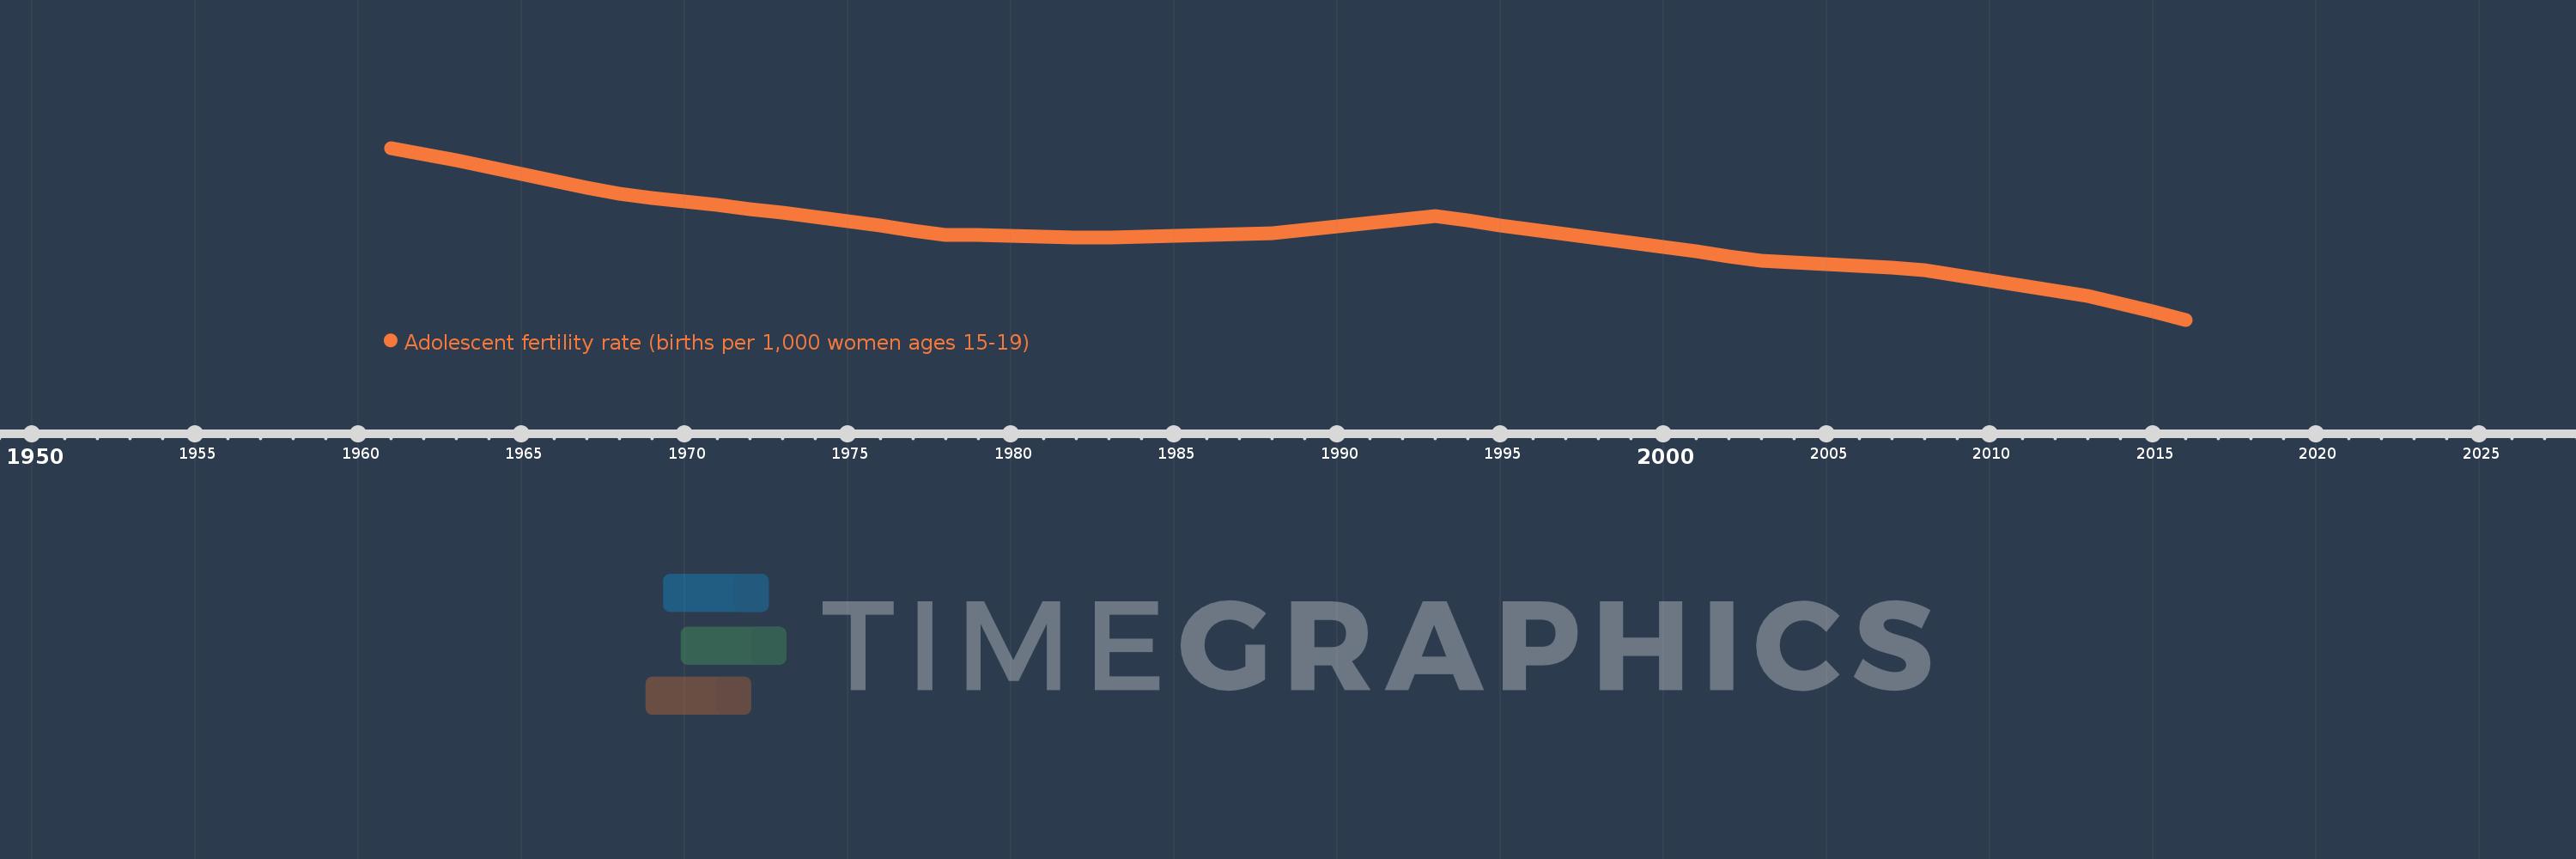
Adolescent fertility rate (births per 1,000 women ages 15-19)
2016,2015,2014,2013,2012,2011,2010,2009,2008,2007,2006,2005,2004,2003,2002,2001,2000,1999,1998,1997,1996,1995,1994,1993,1992,1991,1990,1989,1988,1987,1986,1985,1984,1983,1982,1981,1980,1979,1978,1977,1976,1975,1974,1973,1972,1971,1970,1969,1968,1967,1966,1965,1964,1963,1962,1961
This statistics in other country:
AfghanistanAlbaniaAlgeriaAngolaAntigua and BarbudaArab WorldArgentinaArmeniaArubaAustraliaAustriaAzerbaijanBahamas, TheBahrainBangladeshBarbadosBelarusBelgiumBelizeBeninBhutanBoliviaBosnia and HerzegovinaBotswanaBrazilBrunei DarussalamBulgariaBurkina FasoBurundiCabo VerdeCambodiaCameroonCanadaCaribbean small statesCentral African RepublicCentral Europe and the BalticsChadChannel IslandsChileChinaColombiaComorosCongo, Dem. Rep.Congo, Rep.Costa RicaCote d'IvoireCroatiaCubaCuracaoCyprusCzech RepublicDenmarkDjiboutiDominican RepublicEarly-demographic dividendEast Asia & PacificEast Asia & Pacific (excluding high income)East Asia & Pacific (IDA & IBRD countries)EcuadorEgypt, Arab Rep.El SalvadorEquatorial GuineaEritreaEstoniaEthiopiaEuro areaEurope & Central AsiaEurope & Central Asia (excluding high income)Europe & Central Asia (IDA & IBRD countries)European UnionFijiFinlandFragile and conflict affected situationsFranceFrench PolynesiaGabonGambia, TheGeorgiaGermanyGhanaGreeceGrenadaGuamGuatemalaGuineaGuinea-BissauGuyanaHaitiHeavily indebted poor countries (HIPC)High incomeHondurasHong Kong SAR, ChinaHungaryIBRD onlyIcelandIDA & IBRD totalIDA blendIDA onlyIDA totalIndiaIndonesiaIran, Islamic Rep.IraqIrelandIsraelItalyJamaicaJapanJordanKazakhstanKenyaKiribatiKorea, Dem. People’s Rep.Korea, Rep.KuwaitKyrgyz RepublicLao PDRLate-demographic dividendLatin America & Caribbean Latin America & Caribbean (excluding high income)Latin America & the Caribbean (IDA & IBRD countries)LatviaLeast developed countries: UN classificationLebanonLesothoLiberiaLibyaLithuaniaLow & middle incomeLow incomeLower middle incomeLuxembourgMacao SAR, ChinaMacedonia, FYRMadagascarMalawiMalaysiaMaldivesMaliMaltaMauritaniaMauritiusMexicoMicronesia, Fed. Sts.Middle East & North AfricaMiddle East & North Africa (excluding high income)Middle East & North Africa (IDA & IBRD countries)Middle incomeMoldovaMongoliaMontenegroMoroccoMozambiqueMyanmarNamibiaNepalNetherlandsNew CaledoniaNew ZealandNicaraguaNigerNigeriaNorth AmericaNorwayOECD membersOmanOther small statesPacific island small statesPakistanPanamaPapua New GuineaParaguayPeruPhilippinesPolandPortugalPost-demographic dividendPre-demographic dividendPuerto RicoQatarRomaniaRussian FederationRwandaSamoaSao Tome and PrincipeSaudi ArabiaSenegalSerbiaSeychellesSierra LeoneSingaporeSlovak RepublicSloveniaSmall statesSolomon IslandsSomaliaSouth AfricaSouth AsiaSouth Asia (IDA & IBRD)South SudanSpainSri LankaSt. LuciaSt. Vincent and the GrenadinesSub-Saharan Africa Sub-Saharan Africa (excluding high income)Sub-Saharan Africa (IDA & IBRD countries)SudanSurinameSwazilandSwedenSwitzerlandSyrian Arab RepublicTajikistanTanzaniaThailandTimor-LesteTogoTongaTrinidad and TobagoTunisiaTurkeyTurkmenistanUgandaUkraineUnited Arab EmiratesUnited KingdomUnited StatesUpper middle incomeUruguayUzbekistanVanuatuVenezuela, RBVietnamVirgin Islands (U.S.)West Bank and GazaWorldYemen, Rep.ZambiaZimbabwe Timeline:
This timeline shows a graph from 1961 to 2016 of United States. No data until 1960. Number of actual observations by date: 56.
Source name:
World Development Indicators
Source organization:
United Nations Population Division, World Population Prospects.
Categories, topics:
Health, Gender, Social Development
Last updated:
apr 23, 2017
Indicators value changes by year
Minimum:
21.154
jan 1, 2016
Maximum:
84.987
jan 1, 1961
At the date of observation
Value
Absolute change
Change from previous value
jan 1, 1961
84.987
+84.987
0.0%
jan 1, 1962
82.735
-2.253
-2.65%
jan 1, 1963
80.482
-2.253
-2.72%
jan 1, 1964
77.951
-2.531
-3.15%
jan 1, 1965
75.419
-2.531
-3.25%
jan 1, 1966
72.888
-2.531
-3.36%
jan 1, 1967
70.356
-2.531
-3.47%
jan 1, 1968
67.825
-2.531
-3.6%
jan 1, 1969
66.466
-1.359
-2.0%
jan 1, 1970
65.107
-1.359
-2.04%
jan 1, 1971
63.748
-1.359
-2.09%
jan 1, 1972
62.389
-1.359
-2.13%
jan 1, 1973
61.03
-1.359
-2.18%
jan 1, 1974
59.373
-1.657
-2.72%
jan 1, 1975
57.715
-1.657
-2.79%
jan 1, 1976
56.058
-1.657
-2.87%
jan 1, 1977
54.4
-1.657
-2.96%
jan 1, 1978
52.743
-1.657
-3.05%
jan 1, 1979
52.51
-0.233
-0.44%
jan 1, 1980
52.277
-0.233
-0.44%
jan 1, 1981
52.043
-0.233
-0.45%
jan 1, 1982
51.81
-0.233
-0.45%
jan 1, 1983
51.577
-0.233
-0.45%
jan 1, 1984
51.917
+0.34
0.66%
jan 1, 1985
52.258
+0.34
0.66%
jan 1, 1986
52.598
+0.34
0.65%
jan 1, 1987
52.939
+0.34
0.65%
jan 1, 1988
53.279
+0.34
0.64%
jan 1, 1989
54.546
+1.267
2.38%
jan 1, 1990
55.812
+1.267
2.32%
jan 1, 1991
57.079
+1.267
2.27%
jan 1, 1992
58.345
+1.267
2.22%
jan 1, 1993
59.612
+1.267
2.17%
jan 1, 1994
57.956
-1.656
-2.78%
jan 1, 1995
56.299
-1.656
-2.86%
jan 1, 1996
54.643
-1.656
-2.94%
jan 1, 1997
52.986
-1.656
-3.03%
jan 1, 1998
51.33
-1.656
-3.13%
jan 1, 1999
49.704
-1.626
-3.17%
jan 1, 2000
48.078
-1.626
-3.27%
jan 1, 2001
46.453
-1.626
-3.38%
jan 1, 2002
44.827
-1.626
-3.5%
jan 1, 2003
43.201
-1.626
-3.63%
jan 1, 2004
42.495
-0.706
-1.64%
jan 1, 2005
41.788
-0.706
-1.66%
jan 1, 2006
41.082
-0.706
-1.69%
jan 1, 2007
40.375
-0.706
-1.72%
jan 1, 2008
39.669
-0.706
-1.75%
jan 1, 2009
37.74
-1.929
-4.86%
jan 1, 2010
35.811
-1.929
-5.11%
jan 1, 2011
33.881
-1.929
-5.39%
jan 1, 2012
31.952
-1.929
-5.69%
jan 1, 2013
30.023
-1.929
-6.04%
jan 1, 2014
27.067
-2.956
-9.85%
jan 1, 2015
24.11
-2.956
-10.92%
jan 1, 2016
21.154
-2.956
-12.26%
Ranking of countries by current statistics by years


Comments: