29
/
en
AIzaSyAYiBZKx7MnpbEhh9jyipgxe19OcubqV5w
April 1, 2024
187427
Malaysia
MYS
true
2
1
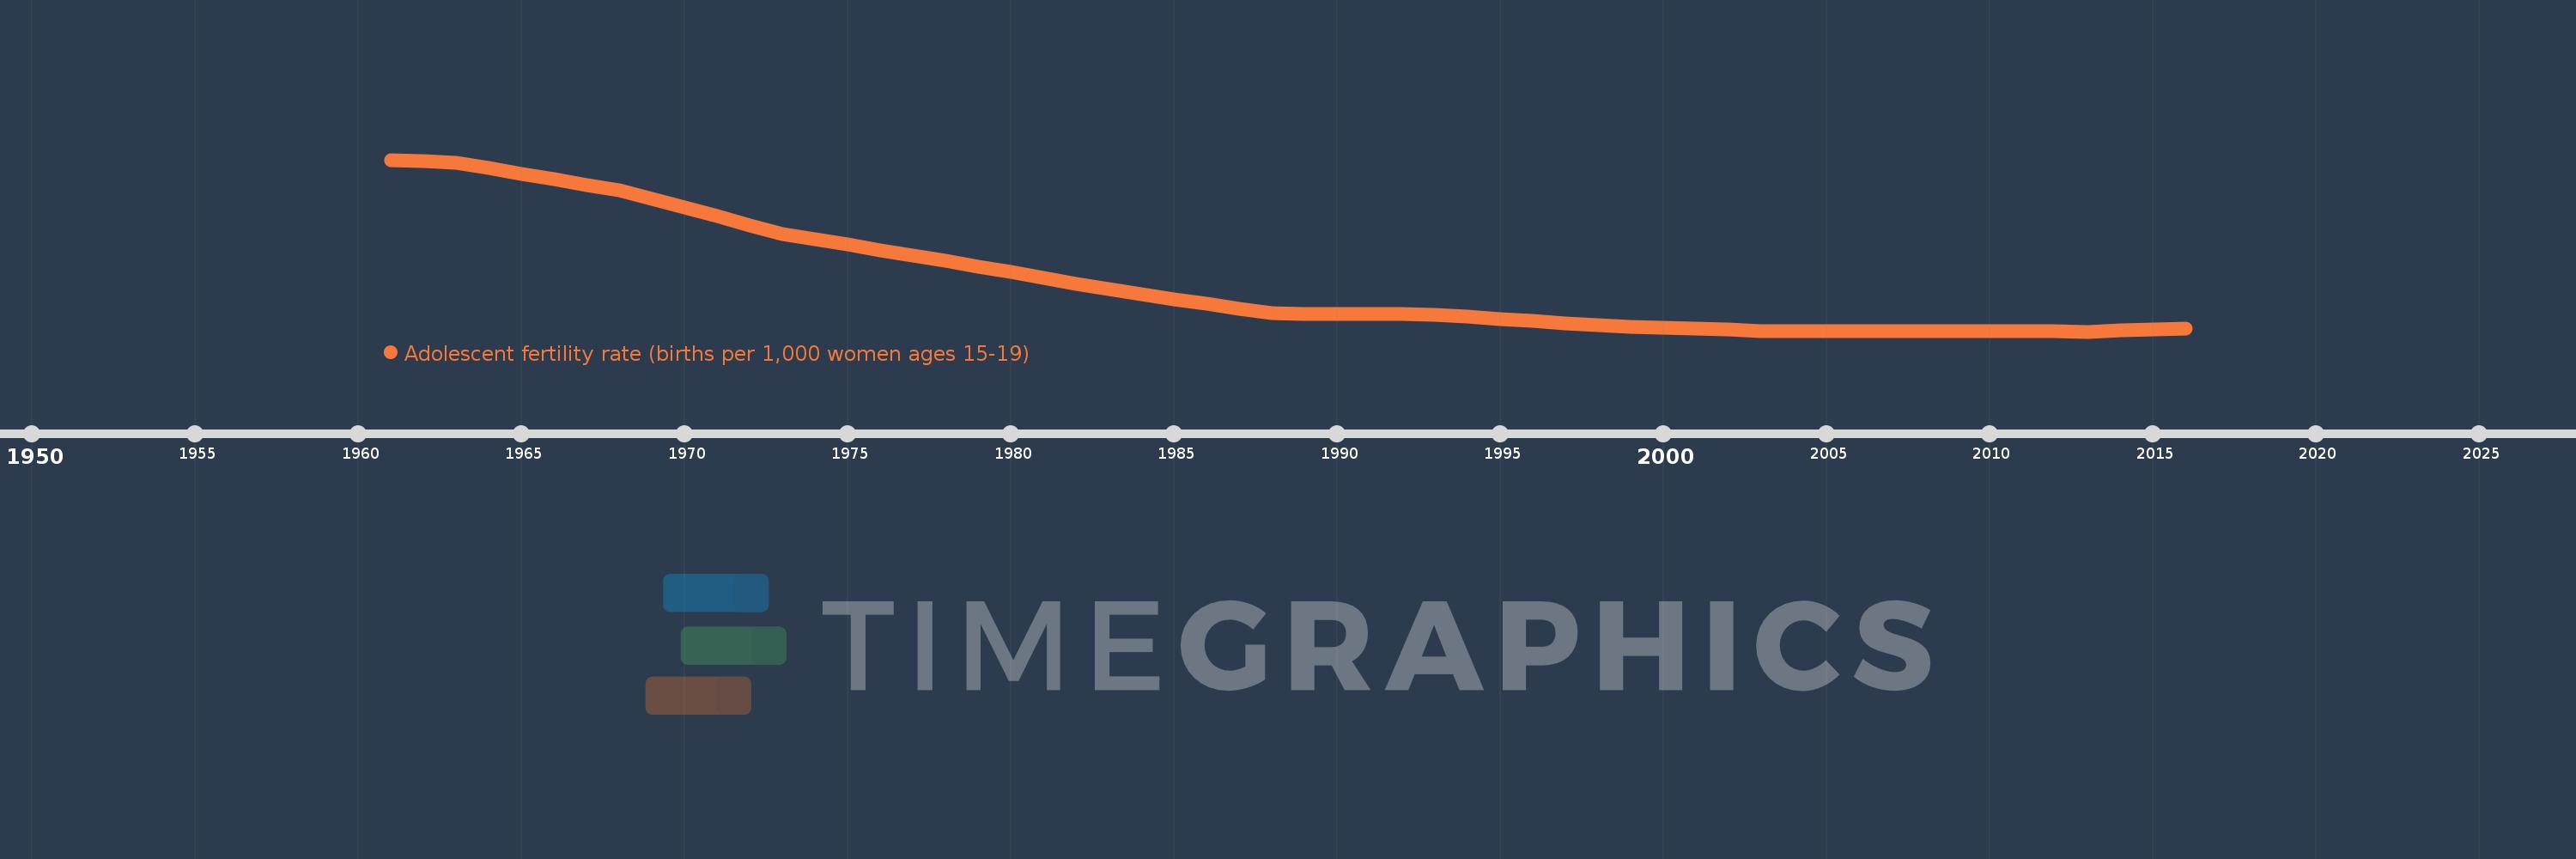
Adolescent fertility rate (births per 1,000 women ages 15-19)
2016,2015,2014,2013,2012,2011,2010,2009,2008,2007,2006,2005,2004,2003,2002,2001,2000,1999,1998,1997,1996,1995,1994,1993,1992,1991,1990,1989,1988,1987,1986,1985,1984,1983,1982,1981,1980,1979,1978,1977,1976,1975,1974,1973,1972,1971,1970,1969,1968,1967,1966,1965,1964,1963,1962,1961
This statistics in other country:
AfghanistanAlbaniaAlgeriaAngolaAntigua and BarbudaArab WorldArgentinaArmeniaArubaAustraliaAustriaAzerbaijanBahamas, TheBahrainBangladeshBarbadosBelarusBelgiumBelizeBeninBhutanBoliviaBosnia and HerzegovinaBotswanaBrazilBrunei DarussalamBulgariaBurkina FasoBurundiCabo VerdeCambodiaCameroonCanadaCaribbean small statesCentral African RepublicCentral Europe and the BalticsChadChannel IslandsChileChinaColombiaComorosCongo, Dem. Rep.Congo, Rep.Costa RicaCote d'IvoireCroatiaCubaCuracaoCyprusCzech RepublicDenmarkDjiboutiDominican RepublicEarly-demographic dividendEast Asia & PacificEast Asia & Pacific (excluding high income)East Asia & Pacific (IDA & IBRD countries)EcuadorEgypt, Arab Rep.El SalvadorEquatorial GuineaEritreaEstoniaEthiopiaEuro areaEurope & Central AsiaEurope & Central Asia (excluding high income)Europe & Central Asia (IDA & IBRD countries)European UnionFijiFinlandFragile and conflict affected situationsFranceFrench PolynesiaGabonGambia, TheGeorgiaGermanyGhanaGreeceGrenadaGuamGuatemalaGuineaGuinea-BissauGuyanaHaitiHeavily indebted poor countries (HIPC)High incomeHondurasHong Kong SAR, ChinaHungaryIBRD onlyIcelandIDA & IBRD totalIDA blendIDA onlyIDA totalIndiaIndonesiaIran, Islamic Rep.IraqIrelandIsraelItalyJamaicaJapanJordanKazakhstanKenyaKiribatiKorea, Dem. People’s Rep.Korea, Rep.KuwaitKyrgyz RepublicLao PDRLate-demographic dividendLatin America & Caribbean Latin America & Caribbean (excluding high income)Latin America & the Caribbean (IDA & IBRD countries)LatviaLeast developed countries: UN classificationLebanonLesothoLiberiaLibyaLithuaniaLow & middle incomeLow incomeLower middle incomeLuxembourgMacao SAR, ChinaMacedonia, FYRMadagascarMalawiMalaysiaMaldivesMaliMaltaMauritaniaMauritiusMexicoMicronesia, Fed. Sts.Middle East & North AfricaMiddle East & North Africa (excluding high income)Middle East & North Africa (IDA & IBRD countries)Middle incomeMoldovaMongoliaMontenegroMoroccoMozambiqueMyanmarNamibiaNepalNetherlandsNew CaledoniaNew ZealandNicaraguaNigerNigeriaNorth AmericaNorwayOECD membersOmanOther small statesPacific island small statesPakistanPanamaPapua New GuineaParaguayPeruPhilippinesPolandPortugalPost-demographic dividendPre-demographic dividendPuerto RicoQatarRomaniaRussian FederationRwandaSamoaSao Tome and PrincipeSaudi ArabiaSenegalSerbiaSeychellesSierra LeoneSingaporeSlovak RepublicSloveniaSmall statesSolomon IslandsSomaliaSouth AfricaSouth AsiaSouth Asia (IDA & IBRD)South SudanSpainSri LankaSt. LuciaSt. Vincent and the GrenadinesSub-Saharan Africa Sub-Saharan Africa (excluding high income)Sub-Saharan Africa (IDA & IBRD countries)SudanSurinameSwazilandSwedenSwitzerlandSyrian Arab RepublicTajikistanTanzaniaThailandTimor-LesteTogoTongaTrinidad and TobagoTunisiaTurkeyTurkmenistanUgandaUkraineUnited Arab EmiratesUnited KingdomUnited StatesUpper middle incomeUruguayUzbekistanVanuatuVenezuela, RBVietnamVirgin Islands (U.S.)West Bank and GazaWorldYemen, Rep.ZambiaZimbabwe Timeline:
This timeline shows a graph from 1961 to 2016 of Malaysia. No data until 1960. Number of actual observations by date: 56.
Source name:
World Development Indicators
Source organization:
United Nations Population Division, World Population Prospects.
Categories, topics:
Health, Gender, Social Development
Last updated:
apr 23, 2017
Indicators value changes by year
Minimum:
12.762
jan 1, 2013
Maximum:
75.425
jan 1, 1961
At the date of observation
Value
Absolute change
Change from previous value
jan 1, 1961
75.425
+75.425
0.0%
jan 1, 1962
74.931
-0.494
-0.65%
jan 1, 1963
74.437
-0.494
-0.66%
jan 1, 1964
72.412
-2.025
-2.72%
jan 1, 1965
70.387
-2.025
-2.8%
jan 1, 1966
68.363
-2.025
-2.88%
jan 1, 1967
66.338
-2.025
-2.96%
jan 1, 1968
64.313
-2.025
-3.05%
jan 1, 1969
61.133
-3.18
-4.94%
jan 1, 1970
57.954
-3.18
-5.2%
jan 1, 1971
54.774
-3.18
-5.49%
jan 1, 1972
51.595
-3.18
-5.8%
jan 1, 1973
48.415
-3.18
-6.16%
jan 1, 1974
46.452
-1.963
-4.05%
jan 1, 1975
44.489
-1.963
-4.23%
jan 1, 1976
42.525
-1.963
-4.41%
jan 1, 1977
40.562
-1.963
-4.62%
jan 1, 1978
38.599
-1.963
-4.84%
jan 1, 1979
36.51
-2.089
-5.41%
jan 1, 1980
34.421
-2.089
-5.72%
jan 1, 1981
32.331
-2.089
-6.07%
jan 1, 1982
30.242
-2.089
-6.46%
jan 1, 1983
28.153
-2.089
-6.91%
jan 1, 1984
26.407
-1.746
-6.2%
jan 1, 1985
24.661
-1.746
-6.61%
jan 1, 1986
22.914
-1.746
-7.08%
jan 1, 1987
21.168
-1.746
-7.62%
jan 1, 1988
19.422
-1.746
-8.25%
jan 1, 1989
19.338
-0.084
-0.43%
jan 1, 1990
19.254
-0.084
-0.43%
jan 1, 1991
19.17
-0.084
-0.44%
jan 1, 1992
19.086
-0.084
-0.44%
jan 1, 1993
19.002
-0.084
-0.44%
jan 1, 1994
18.201
-0.801
-4.21%
jan 1, 1995
17.401
-0.801
-4.4%
jan 1, 1996
16.6
-0.801
-4.6%
jan 1, 1997
15.8
-0.801
-4.82%
jan 1, 1998
14.999
-0.801
-5.07%
jan 1, 1999
14.601
-0.398
-2.65%
jan 1, 2000
14.203
-0.398
-2.73%
jan 1, 2001
13.805
-0.398
-2.8%
jan 1, 2002
13.407
-0.398
-2.88%
jan 1, 2003
13.009
-0.398
-2.97%
jan 1, 2004
12.975
-0.034
-0.26%
jan 1, 2005
12.941
-0.034
-0.26%
jan 1, 2006
12.906
-0.034
-0.26%
jan 1, 2007
12.872
-0.034
-0.26%
jan 1, 2008
12.838
-0.034
-0.27%
jan 1, 2009
12.823
-0.015
-0.12%
jan 1, 2010
12.808
-0.015
-0.12%
jan 1, 2011
12.792
-0.015
-0.12%
jan 1, 2012
12.777
-0.015
-0.12%
jan 1, 2013
12.762
-0.015
-0.12%
jan 1, 2014
13.08
+0.318
2.49%
jan 1, 2015
13.398
+0.318
2.43%
jan 1, 2016
13.717
+0.318
2.37%
Ranking of countries by current statistics by years


Comments: