29
/
en
AIzaSyAYiBZKx7MnpbEhh9jyipgxe19OcubqV5w
April 1, 2024
79775
Barbados
BRB
true
2
1
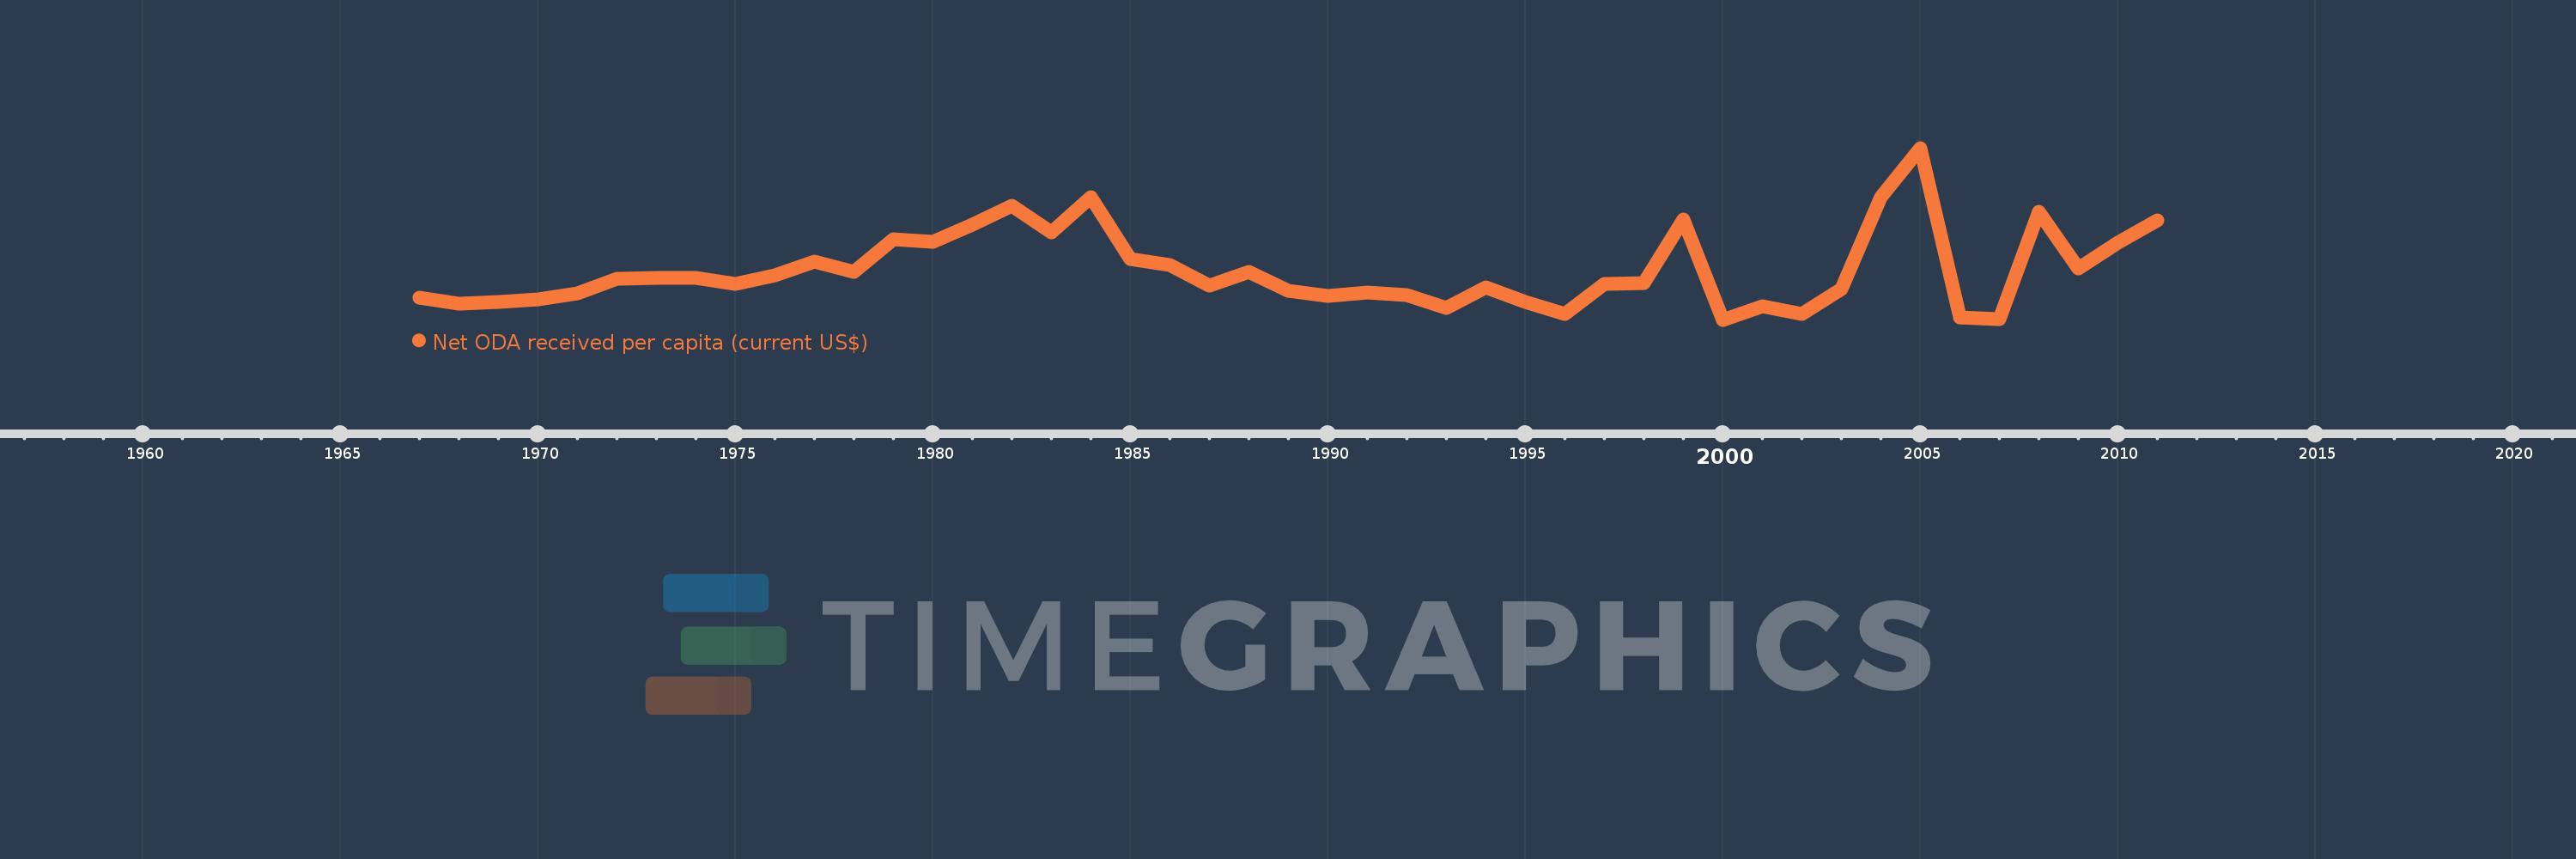
Net ODA received per capita (current US$)
2011,2010,2009,2008,2007,2006,2005,2004,2003,2002,2001,2000,1999,1998,1997,1996,1995,1994,1993,1992,1991,1990,1989,1988,1987,1986,1985,1984,1983,1982,1981,1980,1979,1978,1977,1976,1975,1974,1973,1972,1971,1970,1969,1968,1967
This statistics in other country:
AfghanistanAlbaniaAlgeriaAngolaAntigua and BarbudaArab WorldArgentinaArmeniaArubaAzerbaijanBahamas, TheBahrainBangladeshBarbadosBelarusBelizeBeninBermudaBhutanBoliviaBosnia and HerzegovinaBotswanaBrazilBritish Virgin IslandsBrunei DarussalamBurkina FasoBurundiCabo VerdeCambodiaCameroonCaribbean small statesCayman IslandsCentral African RepublicCentral Europe and the BalticsChadChileChinaColombiaComorosCongo, Dem. Rep.Congo, Rep.Costa RicaCote d'IvoireCroatiaCubaCyprusDjiboutiDominicaDominican RepublicEast Asia & PacificEast Asia & Pacific (excluding high income)East Asia & Pacific (IDA & IBRD countries)EcuadorEgypt, Arab Rep.El SalvadorEquatorial GuineaEritreaEthiopiaEuro areaEurope & Central AsiaEurope & Central Asia (excluding high income)Europe & Central Asia (IDA & IBRD countries)European UnionFijiFragile and conflict affected situationsFrench PolynesiaGabonGambia, TheGeorgiaGhanaGibraltarGrenadaGuatemalaGuineaGuinea-BissauGuyanaHaitiHeavily indebted poor countries (HIPC)High incomeHondurasHong Kong SAR, ChinaIBRD onlyIDA & IBRD totalIDA blendIDA onlyIDA totalIndiaIndonesiaIran, Islamic Rep.IraqIsraelJamaicaJordanKazakhstanKenyaKiribatiKorea, Dem. People’s Rep.Korea, Rep.KosovoKuwaitKyrgyz RepublicLao PDRLatin America & Caribbean Latin America & Caribbean (excluding high income)Latin America & the Caribbean (IDA & IBRD countries)Least developed countries: UN classificationLebanonLesothoLiberiaLibyaLow & middle incomeLow incomeLower middle incomeMacao SAR, ChinaMacedonia, FYRMadagascarMalawiMalaysiaMaldivesMaliMaltaMarshall IslandsMauritaniaMauritiusMexicoMicronesia, Fed. Sts.Middle East & North AfricaMiddle East & North Africa (excluding high income)Middle East & North Africa (IDA & IBRD countries)Middle incomeMoldovaMongoliaMontenegroMoroccoMozambiqueMyanmarNamibiaNauruNepalNew CaledoniaNicaraguaNigerNigeriaNorth AmericaNorthern Mariana IslandsOECD membersOmanOther small statesPacific island small statesPakistanPalauPanamaPapua New GuineaParaguayPeruPhilippinesQatarRwandaSamoaSao Tome and PrincipeSaudi ArabiaSenegalSerbiaSeychellesSierra LeoneSingaporeSloveniaSmall statesSolomon IslandsSomaliaSouth AfricaSouth AsiaSouth Asia (IDA & IBRD)South SudanSri LankaSt. Kitts and NevisSt. LuciaSt. Vincent and the GrenadinesSub-Saharan Africa Sub-Saharan Africa (excluding high income)Sub-Saharan Africa (IDA & IBRD countries)SudanSurinameSwazilandSyrian Arab RepublicTajikistanTanzaniaThailandTimor-LesteTogoTongaTrinidad and TobagoTunisiaTurkeyTurkmenistanTurks and Caicos IslandsTuvaluUgandaUkraineUnited Arab EmiratesUpper middle incomeUruguayUzbekistanVanuatuVenezuela, RBVietnamWest Bank and GazaWorldYemen, Rep.ZambiaZimbabwe Timeline:
This timeline shows a graph from 1967 to 2011 of Barbados. No data until 1966. Number of actual observations by date: 45.
Source name:
World Development Indicators
Source organization:
Development Assistance Committee of the Organisation for Economic Co-operation and Development, Geographical Distribution of Financial Flows to Developing Countries, Development Co-operation Report, and International Development Statistics database. Data are available online at: www.oecd.org/dac/stats/idsonline. World Bank population estimates are used for the denominator.
Categories, topics:
Aid Effectiveness, Economy & Growth, External Debt
Last updated:
apr 23, 2017
Indicators value changes by year
Minimum:
-7.921
jan 1, 2000
Maximum:
105.496
jan 1, 2005
At the date of observation
Value
Absolute change
Change from previous value
jan 1, 1967
6.778
+6.778
0.0%
jan 1, 1968
2.493
-4.285
-63.21%
jan 1, 1969
3.583
+1.09
43.72%
jan 1, 1970
5.464
+1.881
52.48%
jan 1, 1971
9.713
+4.249
77.76%
jan 1, 1972
19.039
+9.325
96.01%
jan 1, 1973
19.591
+0.552
2.9%
jan 1, 1974
19.508
-0.083
-0.42%
jan 1, 1975
15.785
-3.723
-19.08%
jan 1, 1976
21.42
+5.635
35.7%
jan 1, 1977
30.512
+9.092
42.45%
jan 1, 1978
23.394
-7.118
-23.33%
jan 1, 1979
45.274
+21.88
93.53%
jan 1, 1980
43.714
-1.559
-3.44%
jan 1, 1981
54.957
+11.243
25.72%
jan 1, 1982
67.607
+12.65
23.02%
jan 1, 1983
49.875
-17.732
-26.23%
jan 1, 1984
73.08
+23.205
46.53%
jan 1, 1985
31.936
-41.144
-56.3%
jan 1, 1986
28.484
-3.452
-10.81%
jan 1, 1987
14.334
-14.151
-49.68%
jan 1, 1988
23.835
+9.501
66.28%
jan 1, 1989
11.218
-12.617
-52.94%
jan 1, 1990
7.747
-3.47
-30.94%
jan 1, 1991
10.101
+2.354
30.38%
jan 1, 1992
8.114
-1.987
-19.67%
jan 1, 1993
0.114
-7.999
-98.59%
jan 1, 1994
13.683
+13.569
11.86K%
jan 1, 1995
3.863
-9.82
-71.77%
jan 1, 1996
-4.378
-8.241
-213.32%
jan 1, 1997
15.906
+20.284
-463.31%
jan 1, 1998
16.183
+0.277
1.74%
jan 1, 1999
58.444
+42.261
261.14%
jan 1, 2000
-7.921
-66.365
-113.55%
jan 1, 2001
0.889
+8.81
-111.23%
jan 1, 2002
-4.248
-5.138
-577.67%
jan 1, 2003
12.192
+16.441
-386.99%
jan 1, 2004
73.018
+60.826
498.88%
jan 1, 2005
105.496
+32.478
44.48%
jan 1, 2006
-6.606
-112.101
-106.26%
jan 1, 2007
-7.563
-0.957
14.49%
jan 1, 2008
63.407
+70.969
-938.43%
jan 1, 2009
25.675
-37.732
-59.51%
jan 1, 2010
42.95
+17.275
67.28%
jan 1, 2011
57.947
+14.997
34.92%
Ranking of countries by current statistics by years


Comments: