29
/
en
AIzaSyAYiBZKx7MnpbEhh9jyipgxe19OcubqV5w
April 1, 2024
46409
Low income
LIC
false
2
1
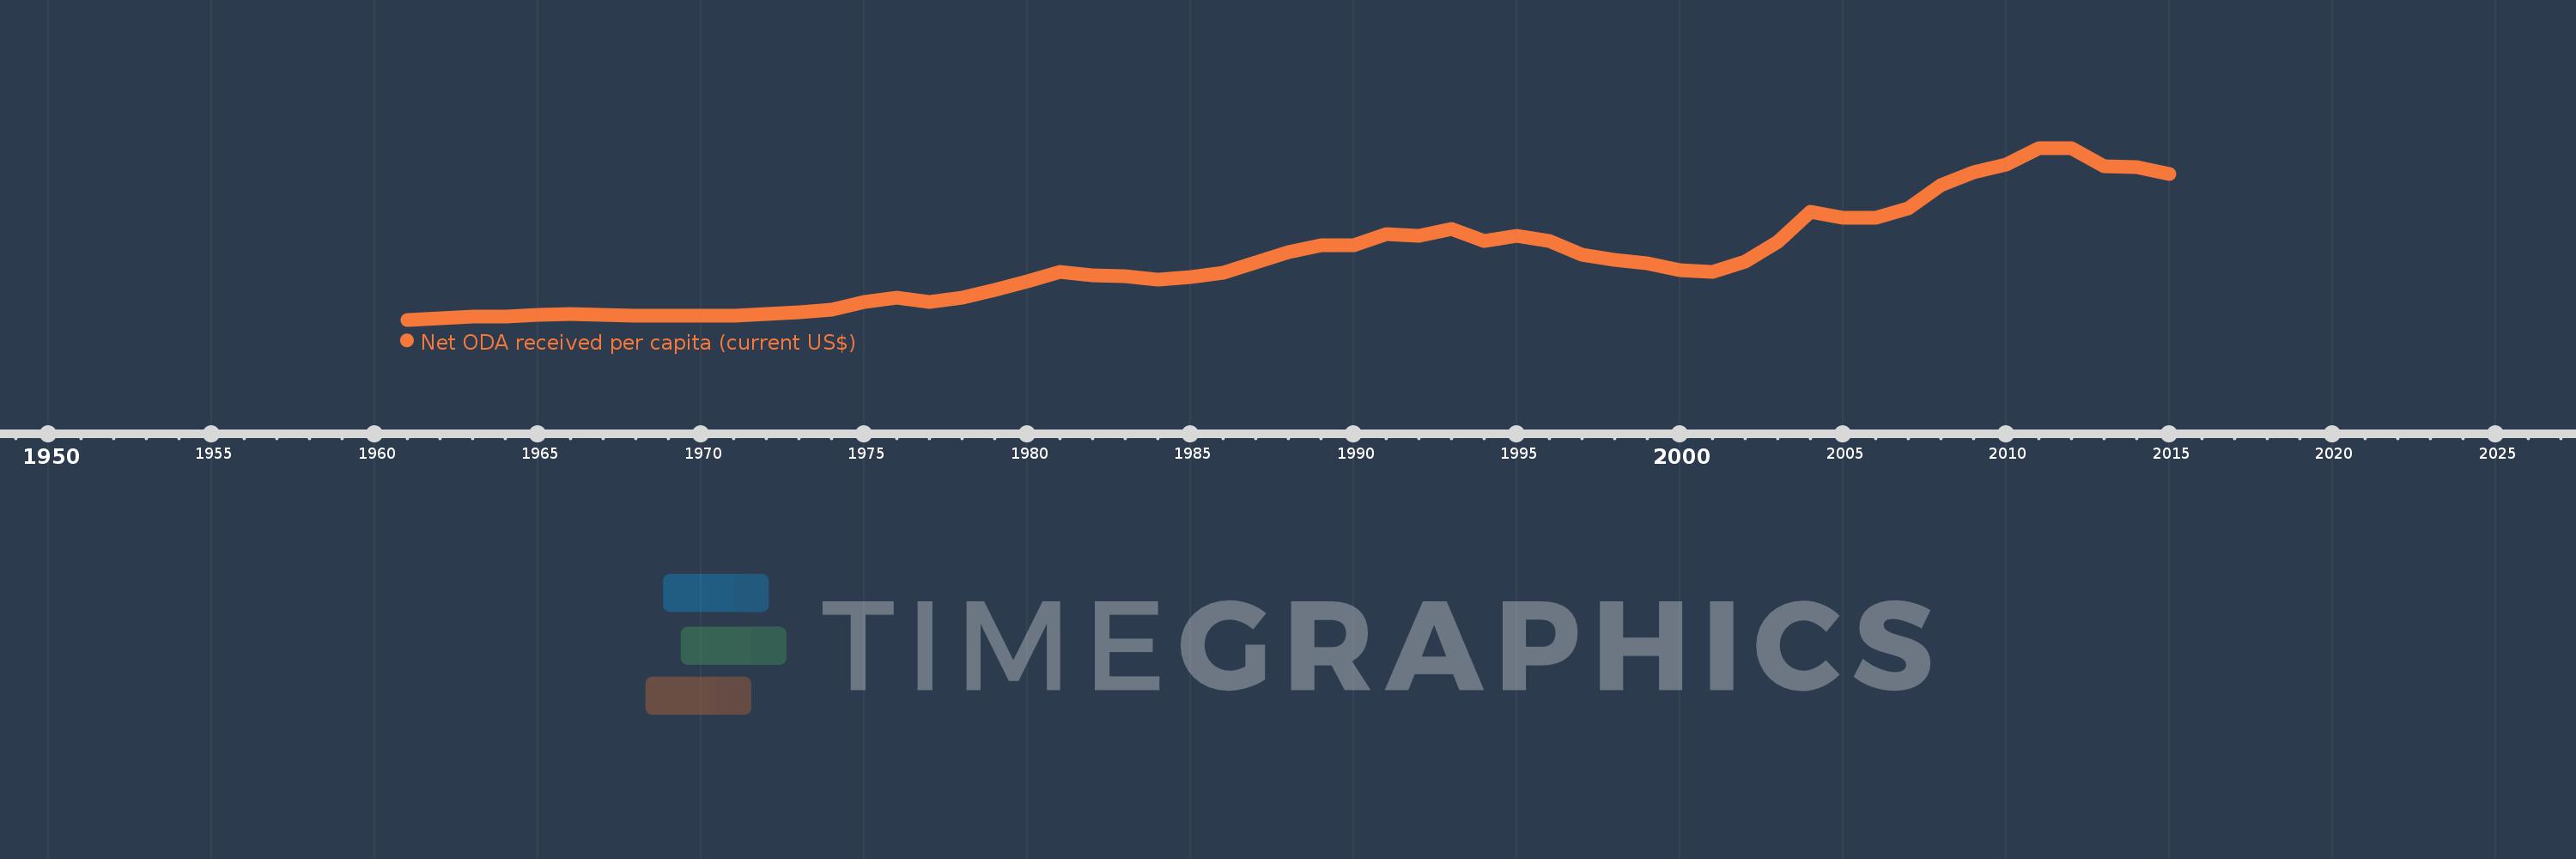
Net ODA received per capita (current US$)
2015,2014,2013,2012,2011,2010,2009,2008,2007,2006,2005,2004,2003,2002,2001,2000,1999,1998,1997,1996,1995,1994,1993,1992,1991,1990,1989,1988,1987,1986,1985,1984,1983,1982,1981,1980,1979,1978,1977,1976,1975,1974,1973,1972,1971,1970,1969,1968,1967,1966,1965,1964,1963,1962,1961
This statistics in other country:
AfghanistanAlbaniaAlgeriaAngolaAntigua and BarbudaArab WorldArgentinaArmeniaArubaAzerbaijanBahamas, TheBahrainBangladeshBarbadosBelarusBelizeBeninBermudaBhutanBoliviaBosnia and HerzegovinaBotswanaBrazilBritish Virgin IslandsBrunei DarussalamBurkina FasoBurundiCabo VerdeCambodiaCameroonCaribbean small statesCayman IslandsCentral African RepublicCentral Europe and the BalticsChadChileChinaColombiaComorosCongo, Dem. Rep.Congo, Rep.Costa RicaCote d'IvoireCroatiaCubaCyprusDjiboutiDominicaDominican RepublicEast Asia & PacificEast Asia & Pacific (excluding high income)East Asia & Pacific (IDA & IBRD countries)EcuadorEgypt, Arab Rep.El SalvadorEquatorial GuineaEritreaEthiopiaEuro areaEurope & Central AsiaEurope & Central Asia (excluding high income)Europe & Central Asia (IDA & IBRD countries)European UnionFijiFragile and conflict affected situationsFrench PolynesiaGabonGambia, TheGeorgiaGhanaGibraltarGrenadaGuatemalaGuineaGuinea-BissauGuyanaHaitiHeavily indebted poor countries (HIPC)High incomeHondurasHong Kong SAR, ChinaIBRD onlyIDA & IBRD totalIDA blendIDA onlyIDA totalIndiaIndonesiaIran, Islamic Rep.IraqIsraelJamaicaJordanKazakhstanKenyaKiribatiKorea, Dem. People’s Rep.Korea, Rep.KosovoKuwaitKyrgyz RepublicLao PDRLatin America & Caribbean Latin America & Caribbean (excluding high income)Latin America & the Caribbean (IDA & IBRD countries)Least developed countries: UN classificationLebanonLesothoLiberiaLibyaLow & middle incomeLow incomeLower middle incomeMacao SAR, ChinaMacedonia, FYRMadagascarMalawiMalaysiaMaldivesMaliMaltaMarshall IslandsMauritaniaMauritiusMexicoMicronesia, Fed. Sts.Middle East & North AfricaMiddle East & North Africa (excluding high income)Middle East & North Africa (IDA & IBRD countries)Middle incomeMoldovaMongoliaMontenegroMoroccoMozambiqueMyanmarNamibiaNauruNepalNew CaledoniaNicaraguaNigerNigeriaNorth AmericaNorthern Mariana IslandsOECD membersOmanOther small statesPacific island small statesPakistanPalauPanamaPapua New GuineaParaguayPeruPhilippinesQatarRwandaSamoaSao Tome and PrincipeSaudi ArabiaSenegalSerbiaSeychellesSierra LeoneSingaporeSloveniaSmall statesSolomon IslandsSomaliaSouth AfricaSouth AsiaSouth Asia (IDA & IBRD)South SudanSri LankaSt. Kitts and NevisSt. LuciaSt. Vincent and the GrenadinesSub-Saharan Africa Sub-Saharan Africa (excluding high income)Sub-Saharan Africa (IDA & IBRD countries)SudanSurinameSwazilandSyrian Arab RepublicTajikistanTanzaniaThailandTimor-LesteTogoTongaTrinidad and TobagoTunisiaTurkeyTurkmenistanTurks and Caicos IslandsTuvaluUgandaUkraineUnited Arab EmiratesUpper middle incomeUruguayUzbekistanVanuatuVenezuela, RBVietnamWest Bank and GazaWorldYemen, Rep.ZambiaZimbabwe Timeline:
This timeline shows a graph from 1961 to 2015 of Low income. No data until 1960. Number of actual observations by date: 55.
Source name:
World Development Indicators
Source organization:
Development Assistance Committee of the Organisation for Economic Co-operation and Development, Geographical Distribution of Financial Flows to Developing Countries, Development Co-operation Report, and International Development Statistics database. Data are available online at: www.oecd.org/dac/stats/idsonline. World Bank population estimates are used for the denominator.
Categories, topics:
Aid Effectiveness, Economy & Growth, External Debt
Last updated:
apr 23, 2017
Indicators value changes by year
Maximum:
65.423
jan 1, 2012
At the date of observation
Value
Absolute change
Change from previous value
jan 1, 1961
1.632
+1.632
0.0%
jan 1, 1962
2.326
+0.694
42.52%
jan 1, 1963
2.923
+0.596
25.63%
jan 1, 1964
2.741
-0.181
-6.21%
jan 1, 1965
3.384
+0.643
23.45%
jan 1, 1966
3.703
+0.319
9.42%
jan 1, 1967
3.571
-0.132
-3.57%
jan 1, 1968
3.197
-0.374
-10.47%
jan 1, 1969
3.201
+0.004
0.11%
jan 1, 1970
3.096
-0.104
-3.26%
jan 1, 1971
3.215
+0.118
3.82%
jan 1, 1972
3.865
+0.65
20.22%
jan 1, 1973
4.252
+0.387
10.01%
jan 1, 1974
5.521
+1.269
29.86%
jan 1, 1975
8.308
+2.787
50.47%
jan 1, 1976
9.858
+1.551
18.67%
jan 1, 1977
8.138
-1.721
-17.45%
jan 1, 1978
9.861
+1.723
21.18%
jan 1, 1979
12.752
+2.89
29.31%
jan 1, 1980
15.737
+2.985
23.41%
jan 1, 1981
19.368
+3.631
23.07%
jan 1, 1982
18.07
-1.297
-6.7%
jan 1, 1983
17.907
-0.163
-0.9%
jan 1, 1984
16.535
-1.373
-7.67%
jan 1, 1985
17.467
+0.933
5.64%
jan 1, 1986
19.048
+1.581
9.05%
jan 1, 1987
22.758
+3.709
19.47%
jan 1, 1988
26.875
+4.118
18.09%
jan 1, 1989
29.162
+2.287
8.51%
jan 1, 1990
29.182
+0.02
0.07%
jan 1, 1991
33.575
+4.393
15.05%
jan 1, 1992
32.792
-0.783
-2.33%
jan 1, 1993
35.328
+2.537
7.74%
jan 1, 1994
30.883
-4.446
-12.58%
jan 1, 1995
32.825
+1.942
6.29%
jan 1, 1996
30.883
-1.942
-5.92%
jan 1, 1997
25.722
-5.161
-16.71%
jan 1, 1998
24.01
-1.712
-6.66%
jan 1, 1999
22.715
-1.295
-5.39%
jan 1, 2000
19.952
-2.763
-12.16%
jan 1, 2001
19.519
-0.433
-2.17%
jan 1, 2002
23.292
+3.773
19.33%
jan 1, 2003
30.628
+7.335
31.49%
jan 1, 2004
41.765
+11.137
36.36%
jan 1, 2005
39.438
-2.328
-5.57%
jan 1, 2006
39.595
+0.158
0.4%
jan 1, 2007
43.139
+3.543
8.95%
jan 1, 2008
51.73
+8.592
19.92%
jan 1, 2009
56.305
+4.574
8.84%
jan 1, 2010
59.365
+3.061
5.44%
jan 1, 2011
65.184
+5.818
9.8%
jan 1, 2012
65.423
+0.239
0.37%
jan 1, 2013
58.777
-6.646
-10.16%
jan 1, 2014
58.346
-0.431
-0.73%
jan 1, 2015
55.765
-2.581
-4.42%
Ranking of countries by current statistics by years


Comments: