29
/
en
AIzaSyAYiBZKx7MnpbEhh9jyipgxe19OcubqV5w
April 1, 2024
54298
Pacific island small states
PSS
false
2
1
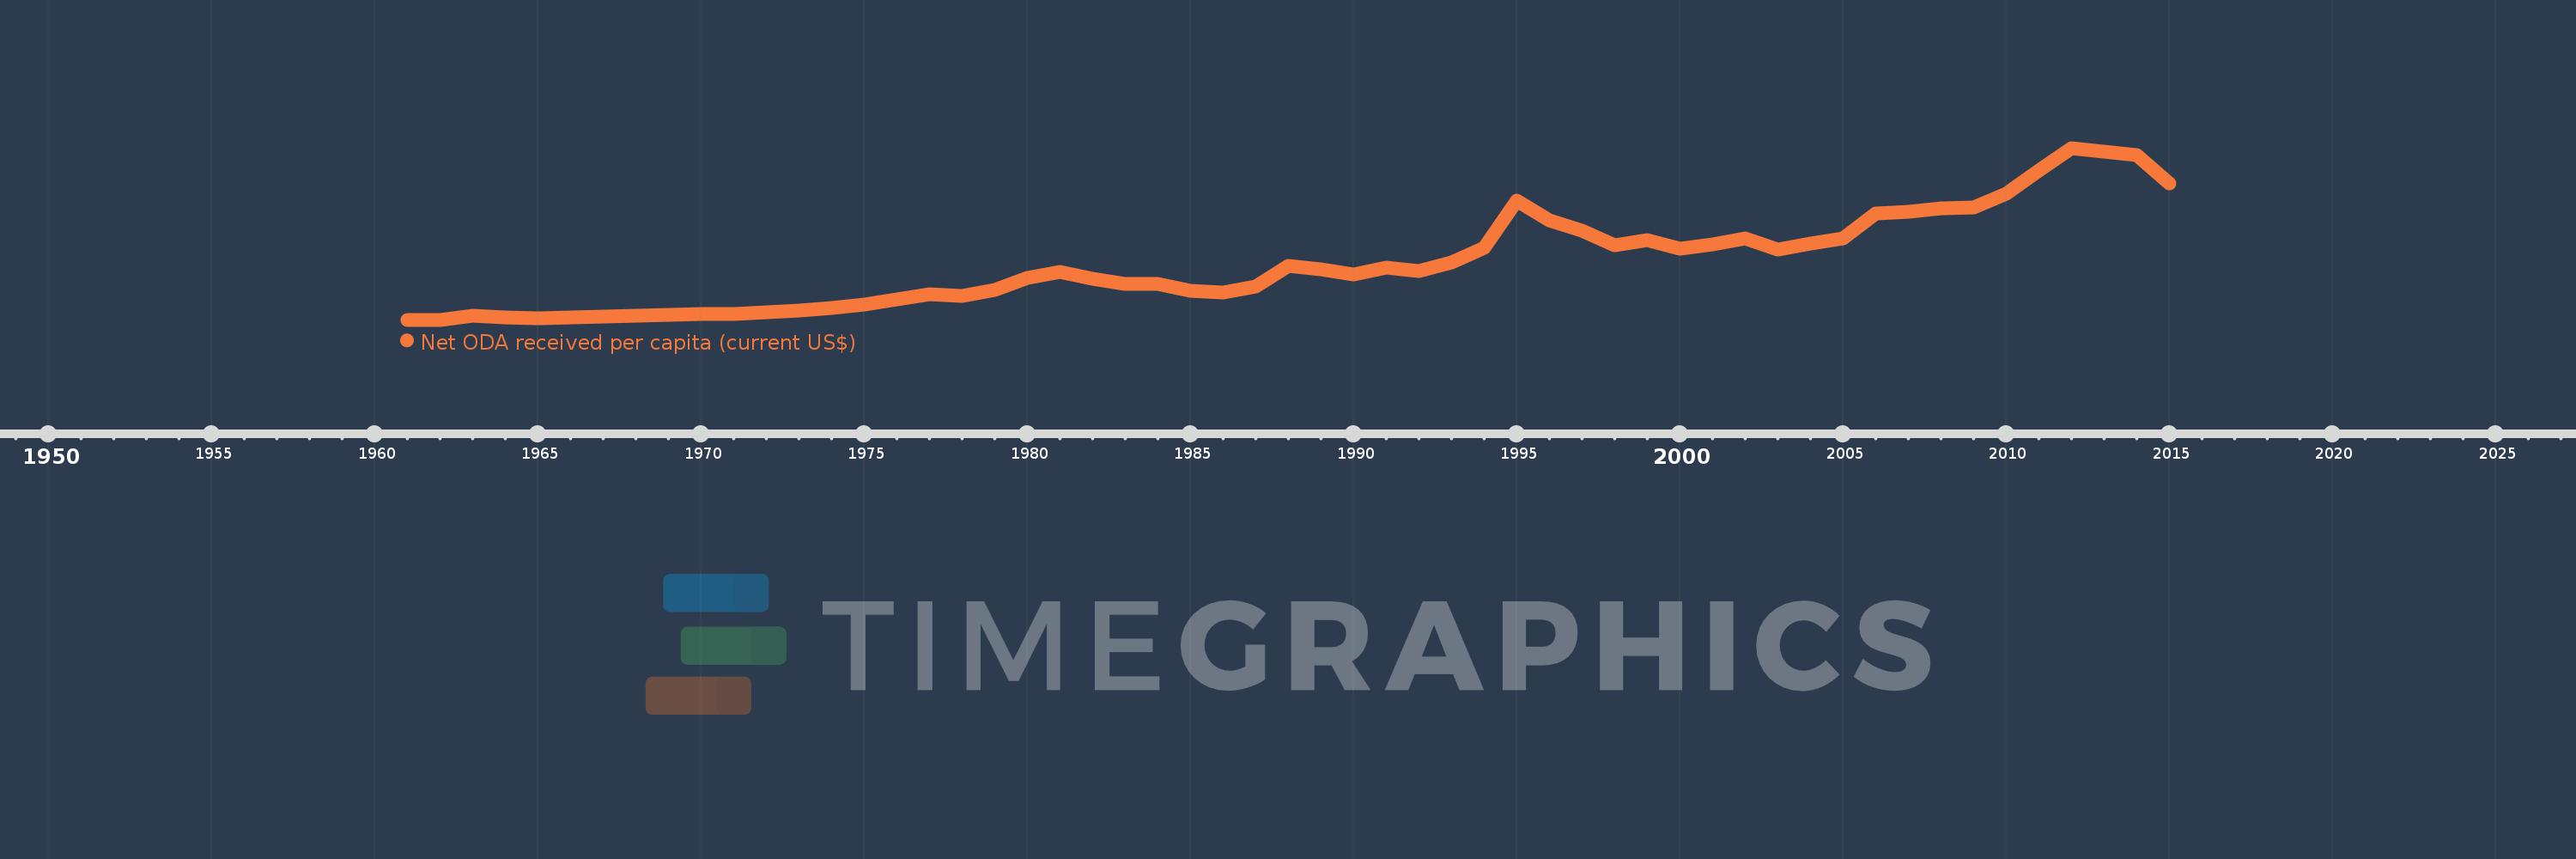
Net ODA received per capita (current US$)
2015,2014,2013,2012,2011,2010,2009,2008,2007,2006,2005,2004,2003,2002,2001,2000,1999,1998,1997,1996,1995,1994,1993,1992,1991,1990,1989,1988,1987,1986,1985,1984,1983,1982,1981,1980,1979,1978,1977,1976,1975,1974,1973,1972,1971,1970,1969,1968,1967,1966,1965,1964,1963,1962,1961
This statistics in other country:
AfghanistanAlbaniaAlgeriaAngolaAntigua and BarbudaArab WorldArgentinaArmeniaArubaAzerbaijanBahamas, TheBahrainBangladeshBarbadosBelarusBelizeBeninBermudaBhutanBoliviaBosnia and HerzegovinaBotswanaBrazilBritish Virgin IslandsBrunei DarussalamBurkina FasoBurundiCabo VerdeCambodiaCameroonCaribbean small statesCayman IslandsCentral African RepublicCentral Europe and the BalticsChadChileChinaColombiaComorosCongo, Dem. Rep.Congo, Rep.Costa RicaCote d'IvoireCroatiaCubaCyprusDjiboutiDominicaDominican RepublicEast Asia & PacificEast Asia & Pacific (excluding high income)East Asia & Pacific (IDA & IBRD countries)EcuadorEgypt, Arab Rep.El SalvadorEquatorial GuineaEritreaEthiopiaEuro areaEurope & Central AsiaEurope & Central Asia (excluding high income)Europe & Central Asia (IDA & IBRD countries)European UnionFijiFragile and conflict affected situationsFrench PolynesiaGabonGambia, TheGeorgiaGhanaGibraltarGrenadaGuatemalaGuineaGuinea-BissauGuyanaHaitiHeavily indebted poor countries (HIPC)High incomeHondurasHong Kong SAR, ChinaIBRD onlyIDA & IBRD totalIDA blendIDA onlyIDA totalIndiaIndonesiaIran, Islamic Rep.IraqIsraelJamaicaJordanKazakhstanKenyaKiribatiKorea, Dem. People’s Rep.Korea, Rep.KosovoKuwaitKyrgyz RepublicLao PDRLatin America & Caribbean Latin America & Caribbean (excluding high income)Latin America & the Caribbean (IDA & IBRD countries)Least developed countries: UN classificationLebanonLesothoLiberiaLibyaLow & middle incomeLow incomeLower middle incomeMacao SAR, ChinaMacedonia, FYRMadagascarMalawiMalaysiaMaldivesMaliMaltaMarshall IslandsMauritaniaMauritiusMexicoMicronesia, Fed. Sts.Middle East & North AfricaMiddle East & North Africa (excluding high income)Middle East & North Africa (IDA & IBRD countries)Middle incomeMoldovaMongoliaMontenegroMoroccoMozambiqueMyanmarNamibiaNauruNepalNew CaledoniaNicaraguaNigerNigeriaNorth AmericaNorthern Mariana IslandsOECD membersOmanOther small statesPacific island small statesPakistanPalauPanamaPapua New GuineaParaguayPeruPhilippinesQatarRwandaSamoaSao Tome and PrincipeSaudi ArabiaSenegalSerbiaSeychellesSierra LeoneSingaporeSloveniaSmall statesSolomon IslandsSomaliaSouth AfricaSouth AsiaSouth Asia (IDA & IBRD)South SudanSri LankaSt. Kitts and NevisSt. LuciaSt. Vincent and the GrenadinesSub-Saharan Africa Sub-Saharan Africa (excluding high income)Sub-Saharan Africa (IDA & IBRD countries)SudanSurinameSwazilandSyrian Arab RepublicTajikistanTanzaniaThailandTimor-LesteTogoTongaTrinidad and TobagoTunisiaTurkeyTurkmenistanTurks and Caicos IslandsTuvaluUgandaUkraineUnited Arab EmiratesUpper middle incomeUruguayUzbekistanVanuatuVenezuela, RBVietnamWest Bank and GazaWorldYemen, Rep.ZambiaZimbabwe Timeline:
This timeline shows a graph from 1961 to 2015 of Pacific island small states. No data until 1960. Number of actual observations by date: 55.
Source name:
World Development Indicators
Source organization:
Development Assistance Committee of the Organisation for Economic Co-operation and Development, Geographical Distribution of Financial Flows to Developing Countries, Development Co-operation Report, and International Development Statistics database. Data are available online at: www.oecd.org/dac/stats/idsonline. World Bank population estimates are used for the denominator.
Categories, topics:
Aid Effectiveness, Economy & Growth, External Debt
Last updated:
apr 23, 2017
Indicators value changes by year
Maximum:
469.71
jan 1, 2012
At the date of observation
Value
Absolute change
Change from previous value
jan 1, 1961
3.58
+3.58
0.0%
jan 1, 1962
4.037
+0.457
12.75%
jan 1, 1963
15.169
+11.132
275.75%
jan 1, 1964
8.92
-6.249
-41.19%
jan 1, 1965
7.658
-1.262
-14.15%
jan 1, 1966
10.17
+2.511
32.79%
jan 1, 1967
12.675
+2.506
24.64%
jan 1, 1968
13.4
+0.725
5.72%
jan 1, 1969
17.446
+4.046
30.19%
jan 1, 1970
19.451
+2.006
11.5%
jan 1, 1971
20.338
+0.887
4.56%
jan 1, 1972
23.525
+3.187
15.67%
jan 1, 1973
29.607
+6.082
25.85%
jan 1, 1974
36.106
+6.499
21.95%
jan 1, 1975
45.523
+9.417
26.08%
jan 1, 1976
59.426
+13.903
30.54%
jan 1, 1977
73.806
+14.379
24.2%
jan 1, 1978
67.185
-6.621
-8.97%
jan 1, 1979
84.18
+16.995
25.3%
jan 1, 1980
116.493
+32.313
38.39%
jan 1, 1981
133.379
+16.886
14.5%
jan 1, 1982
113.736
-19.643
-14.73%
jan 1, 1983
101.183
-12.553
-11.04%
jan 1, 1984
99.901
-1.282
-1.27%
jan 1, 1985
82.1
-17.801
-17.82%
jan 1, 1986
76.825
-5.275
-6.42%
jan 1, 1987
94.253
+17.428
22.69%
jan 1, 1988
149.003
+54.75
58.09%
jan 1, 1989
139.241
-9.762
-6.55%
jan 1, 1990
126.479
-12.762
-9.17%
jan 1, 1991
145.979
+19.501
15.42%
jan 1, 1992
136.773
-9.207
-6.31%
jan 1, 1993
158.511
+21.738
15.89%
jan 1, 1994
197.555
+39.044
24.63%
jan 1, 1995
326.294
+128.739
65.17%
jan 1, 1996
272.162
-54.132
-16.59%
jan 1, 1997
244.397
-27.765
-10.2%
jan 1, 1998
206.476
-37.92
-15.52%
jan 1, 1999
220.213
+13.736
6.65%
jan 1, 2000
197.33
-22.882
-10.39%
jan 1, 2001
208.238
+10.908
5.53%
jan 1, 2002
225.426
+17.187
8.25%
jan 1, 2003
193.04
-32.386
-14.37%
jan 1, 2004
211.065
+18.026
9.34%
jan 1, 2005
223.41
+12.345
5.85%
jan 1, 2006
291.501
+68.091
30.48%
jan 1, 2007
295.907
+4.406
1.51%
jan 1, 2008
305.895
+9.988
3.38%
jan 1, 2009
307.128
+1.233
0.4%
jan 1, 2010
346.476
+39.348
12.81%
jan 1, 2011
408.561
+62.085
17.92%
jan 1, 2012
469.71
+61.149
14.97%
jan 1, 2013
460.661
-9.05
-1.93%
jan 1, 2014
450.246
-10.415
-2.26%
jan 1, 2015
374.566
-75.68
-16.81%
Ranking of countries by current statistics by years


Comments: