29
/
en
AIzaSyAYiBZKx7MnpbEhh9jyipgxe19OcubqV5w
April 1, 2024
45399
Low & middle income
LMY
false
2
1
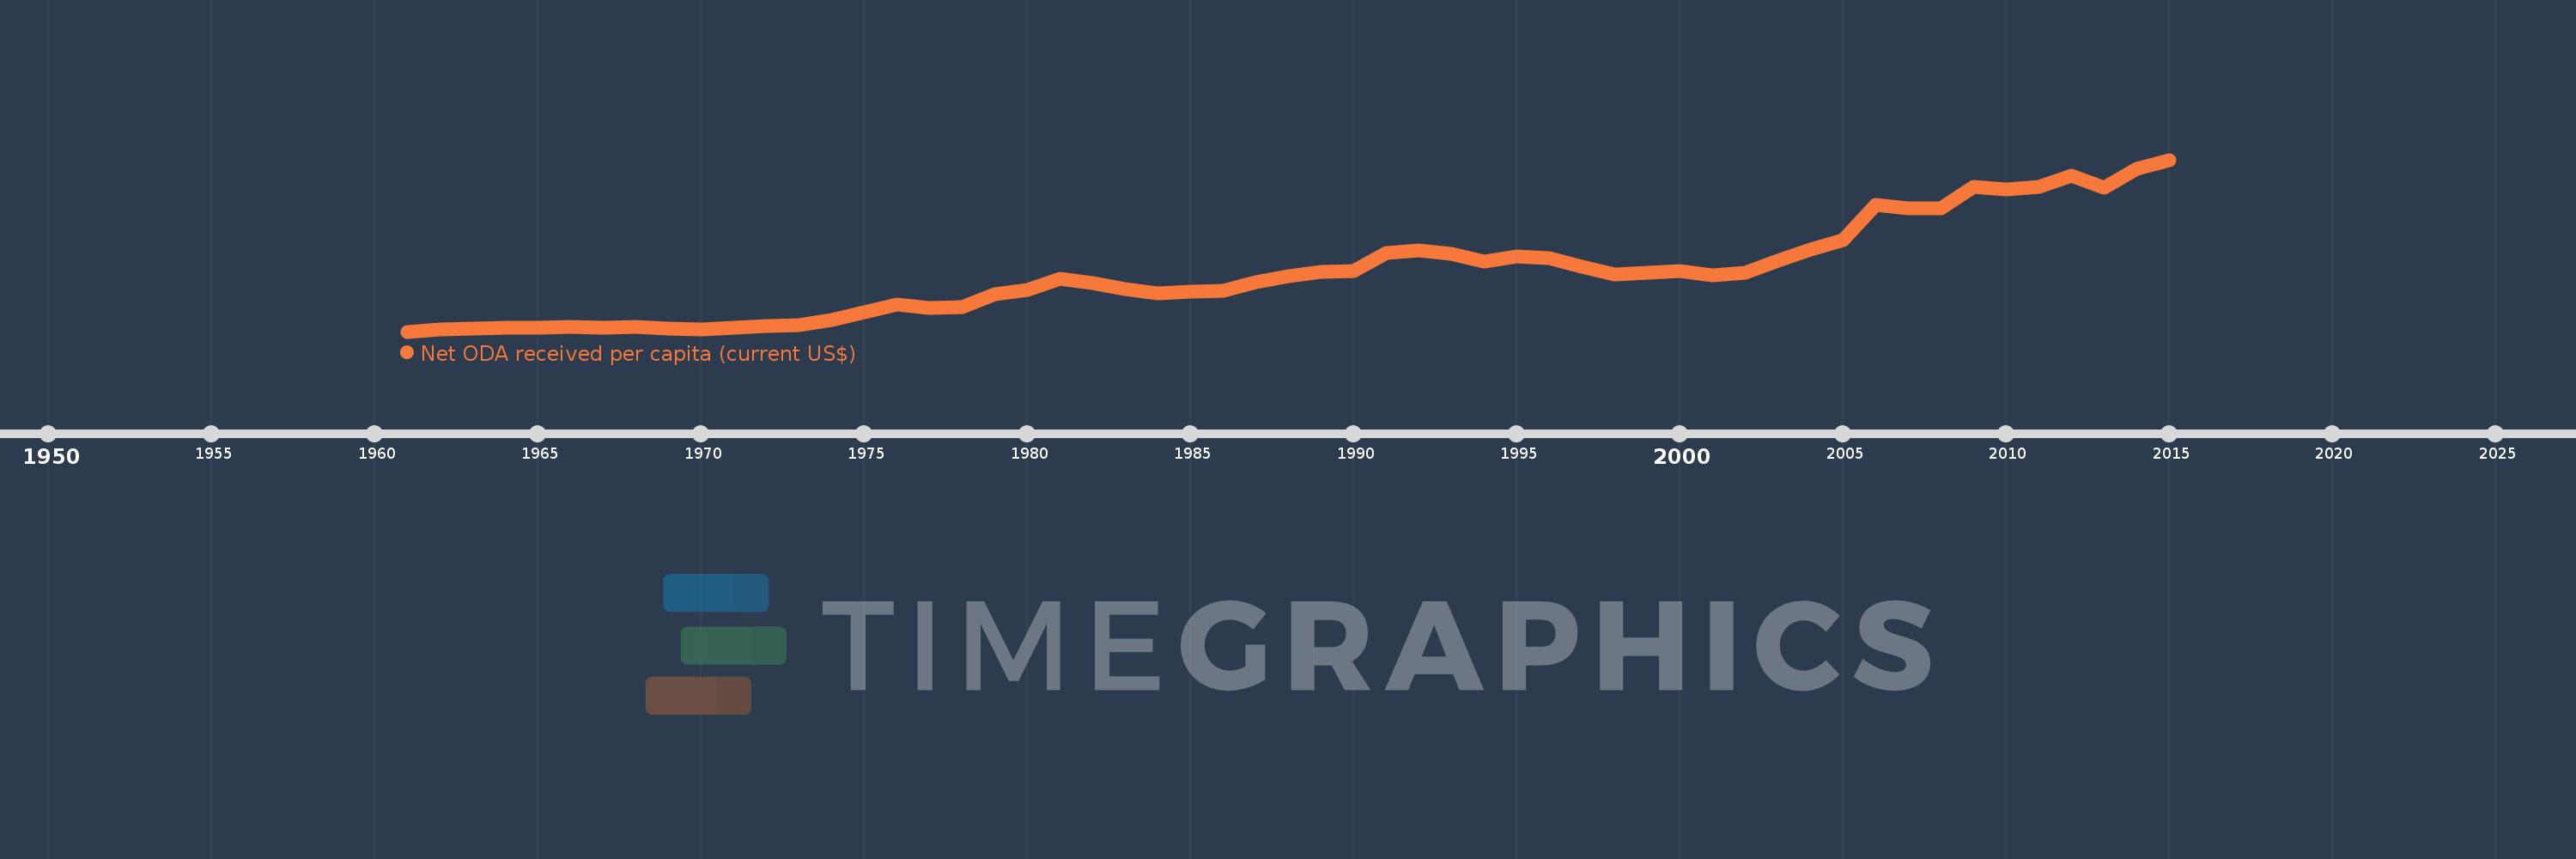
Net ODA received per capita (current US$)
2015,2014,2013,2012,2011,2010,2009,2008,2007,2006,2005,2004,2003,2002,2001,2000,1999,1998,1997,1996,1995,1994,1993,1992,1991,1990,1989,1988,1987,1986,1985,1984,1983,1982,1981,1980,1979,1978,1977,1976,1975,1974,1973,1972,1971,1970,1969,1968,1967,1966,1965,1964,1963,1962,1961
This statistics in other country:
AfghanistanAlbaniaAlgeriaAngolaAntigua and BarbudaArab WorldArgentinaArmeniaArubaAzerbaijanBahamas, TheBahrainBangladeshBarbadosBelarusBelizeBeninBermudaBhutanBoliviaBosnia and HerzegovinaBotswanaBrazilBritish Virgin IslandsBrunei DarussalamBurkina FasoBurundiCabo VerdeCambodiaCameroonCaribbean small statesCayman IslandsCentral African RepublicCentral Europe and the BalticsChadChileChinaColombiaComorosCongo, Dem. Rep.Congo, Rep.Costa RicaCote d'IvoireCroatiaCubaCyprusDjiboutiDominicaDominican RepublicEast Asia & PacificEast Asia & Pacific (excluding high income)East Asia & Pacific (IDA & IBRD countries)EcuadorEgypt, Arab Rep.El SalvadorEquatorial GuineaEritreaEthiopiaEuro areaEurope & Central AsiaEurope & Central Asia (excluding high income)Europe & Central Asia (IDA & IBRD countries)European UnionFijiFragile and conflict affected situationsFrench PolynesiaGabonGambia, TheGeorgiaGhanaGibraltarGrenadaGuatemalaGuineaGuinea-BissauGuyanaHaitiHeavily indebted poor countries (HIPC)High incomeHondurasHong Kong SAR, ChinaIBRD onlyIDA & IBRD totalIDA blendIDA onlyIDA totalIndiaIndonesiaIran, Islamic Rep.IraqIsraelJamaicaJordanKazakhstanKenyaKiribatiKorea, Dem. People’s Rep.Korea, Rep.KosovoKuwaitKyrgyz RepublicLao PDRLatin America & Caribbean Latin America & Caribbean (excluding high income)Latin America & the Caribbean (IDA & IBRD countries)Least developed countries: UN classificationLebanonLesothoLiberiaLibyaLow & middle incomeLow incomeLower middle incomeMacao SAR, ChinaMacedonia, FYRMadagascarMalawiMalaysiaMaldivesMaliMaltaMarshall IslandsMauritaniaMauritiusMexicoMicronesia, Fed. Sts.Middle East & North AfricaMiddle East & North Africa (excluding high income)Middle East & North Africa (IDA & IBRD countries)Middle incomeMoldovaMongoliaMontenegroMoroccoMozambiqueMyanmarNamibiaNauruNepalNew CaledoniaNicaraguaNigerNigeriaNorth AmericaNorthern Mariana IslandsOECD membersOmanOther small statesPacific island small statesPakistanPalauPanamaPapua New GuineaParaguayPeruPhilippinesQatarRwandaSamoaSao Tome and PrincipeSaudi ArabiaSenegalSerbiaSeychellesSierra LeoneSingaporeSloveniaSmall statesSolomon IslandsSomaliaSouth AfricaSouth AsiaSouth Asia (IDA & IBRD)South SudanSri LankaSt. Kitts and NevisSt. LuciaSt. Vincent and the GrenadinesSub-Saharan Africa Sub-Saharan Africa (excluding high income)Sub-Saharan Africa (IDA & IBRD countries)SudanSurinameSwazilandSyrian Arab RepublicTajikistanTanzaniaThailandTimor-LesteTogoTongaTrinidad and TobagoTunisiaTurkeyTurkmenistanTurks and Caicos IslandsTuvaluUgandaUkraineUnited Arab EmiratesUpper middle incomeUruguayUzbekistanVanuatuVenezuela, RBVietnamWest Bank and GazaWorldYemen, Rep.ZambiaZimbabwe Timeline:
This timeline shows a graph from 1961 to 2015 of Low & middle income. No data until 1960. Number of actual observations by date: 55.
Source name:
World Development Indicators
Source organization:
Development Assistance Committee of the Organisation for Economic Co-operation and Development, Geographical Distribution of Financial Flows to Developing Countries, Development Co-operation Report, and International Development Statistics database. Data are available online at: www.oecd.org/dac/stats/idsonline. World Bank population estimates are used for the denominator.
Categories, topics:
Aid Effectiveness, Economy & Growth, External Debt
Last updated:
apr 23, 2017
Indicators value changes by year
Maximum:
26.421
jan 1, 2015
At the date of observation
Value
Absolute change
Change from previous value
jan 1, 1961
1.619
+1.619
0.0%
jan 1, 1962
1.987
+0.368
22.75%
jan 1, 1963
2.021
+0.034
1.72%
jan 1, 1964
2.165
+0.144
7.12%
jan 1, 1965
2.174
+0.009
0.43%
jan 1, 1966
2.27
+0.096
4.42%
jan 1, 1967
2.231
-0.039
-1.72%
jan 1, 1968
2.264
+0.033
1.48%
jan 1, 1969
2.068
-0.196
-8.66%
jan 1, 1970
1.973
-0.095
-4.61%
jan 1, 1971
2.184
+0.211
10.7%
jan 1, 1972
2.422
+0.239
10.93%
jan 1, 1973
2.491
+0.069
2.84%
jan 1, 1974
3.298
+0.807
32.38%
jan 1, 1975
4.404
+1.106
33.54%
jan 1, 1976
5.479
+1.074
24.39%
jan 1, 1977
5.089
-0.39
-7.11%
jan 1, 1978
5.12
+0.031
0.6%
jan 1, 1979
7.014
+1.894
37.0%
jan 1, 1980
7.668
+0.654
9.33%
jan 1, 1981
9.206
+1.538
20.05%
jan 1, 1982
8.647
-0.559
-6.07%
jan 1, 1983
7.754
-0.893
-10.33%
jan 1, 1984
7.145
-0.609
-7.85%
jan 1, 1985
7.346
+0.201
2.82%
jan 1, 1986
7.551
+0.204
2.78%
jan 1, 1987
8.702
+1.151
15.25%
jan 1, 1988
9.637
+0.935
10.74%
jan 1, 1989
10.226
+0.589
6.11%
jan 1, 1990
10.379
+0.153
1.5%
jan 1, 1991
12.937
+2.557
24.64%
jan 1, 1992
13.392
+0.455
3.52%
jan 1, 1993
12.841
-0.551
-4.12%
jan 1, 1994
11.677
-1.163
-9.06%
jan 1, 1995
12.434
+0.757
6.48%
jan 1, 1996
12.163
-0.271
-2.18%
jan 1, 1997
11.013
-1.15
-9.46%
jan 1, 1998
9.856
-1.157
-10.5%
jan 1, 1999
10.143
+0.287
2.91%
jan 1, 2000
10.393
+0.25
2.47%
jan 1, 2001
9.741
-0.652
-6.27%
jan 1, 2002
10.09
+0.349
3.58%
jan 1, 2003
11.819
+1.729
17.14%
jan 1, 2004
13.485
+1.666
14.09%
jan 1, 2005
14.884
+1.399
10.38%
jan 1, 2006
19.972
+5.088
34.18%
jan 1, 2007
19.429
-0.543
-2.72%
jan 1, 2008
19.364
-0.065
-0.33%
jan 1, 2009
22.542
+3.178
16.41%
jan 1, 2010
22.123
-0.419
-1.86%
jan 1, 2011
22.535
+0.412
1.86%
jan 1, 2012
24.148
+1.613
7.16%
jan 1, 2013
22.335
-1.813
-7.51%
jan 1, 2014
25.087
+2.752
12.32%
jan 1, 2015
26.421
+1.334
5.32%
Ranking of countries by current statistics by years


Comments: