29
/
en
AIzaSyAYiBZKx7MnpbEhh9jyipgxe19OcubqV5w
April 1, 2024
50296
Middle East & North Africa (IDA & IBRD countries)
TMN
false
2
1
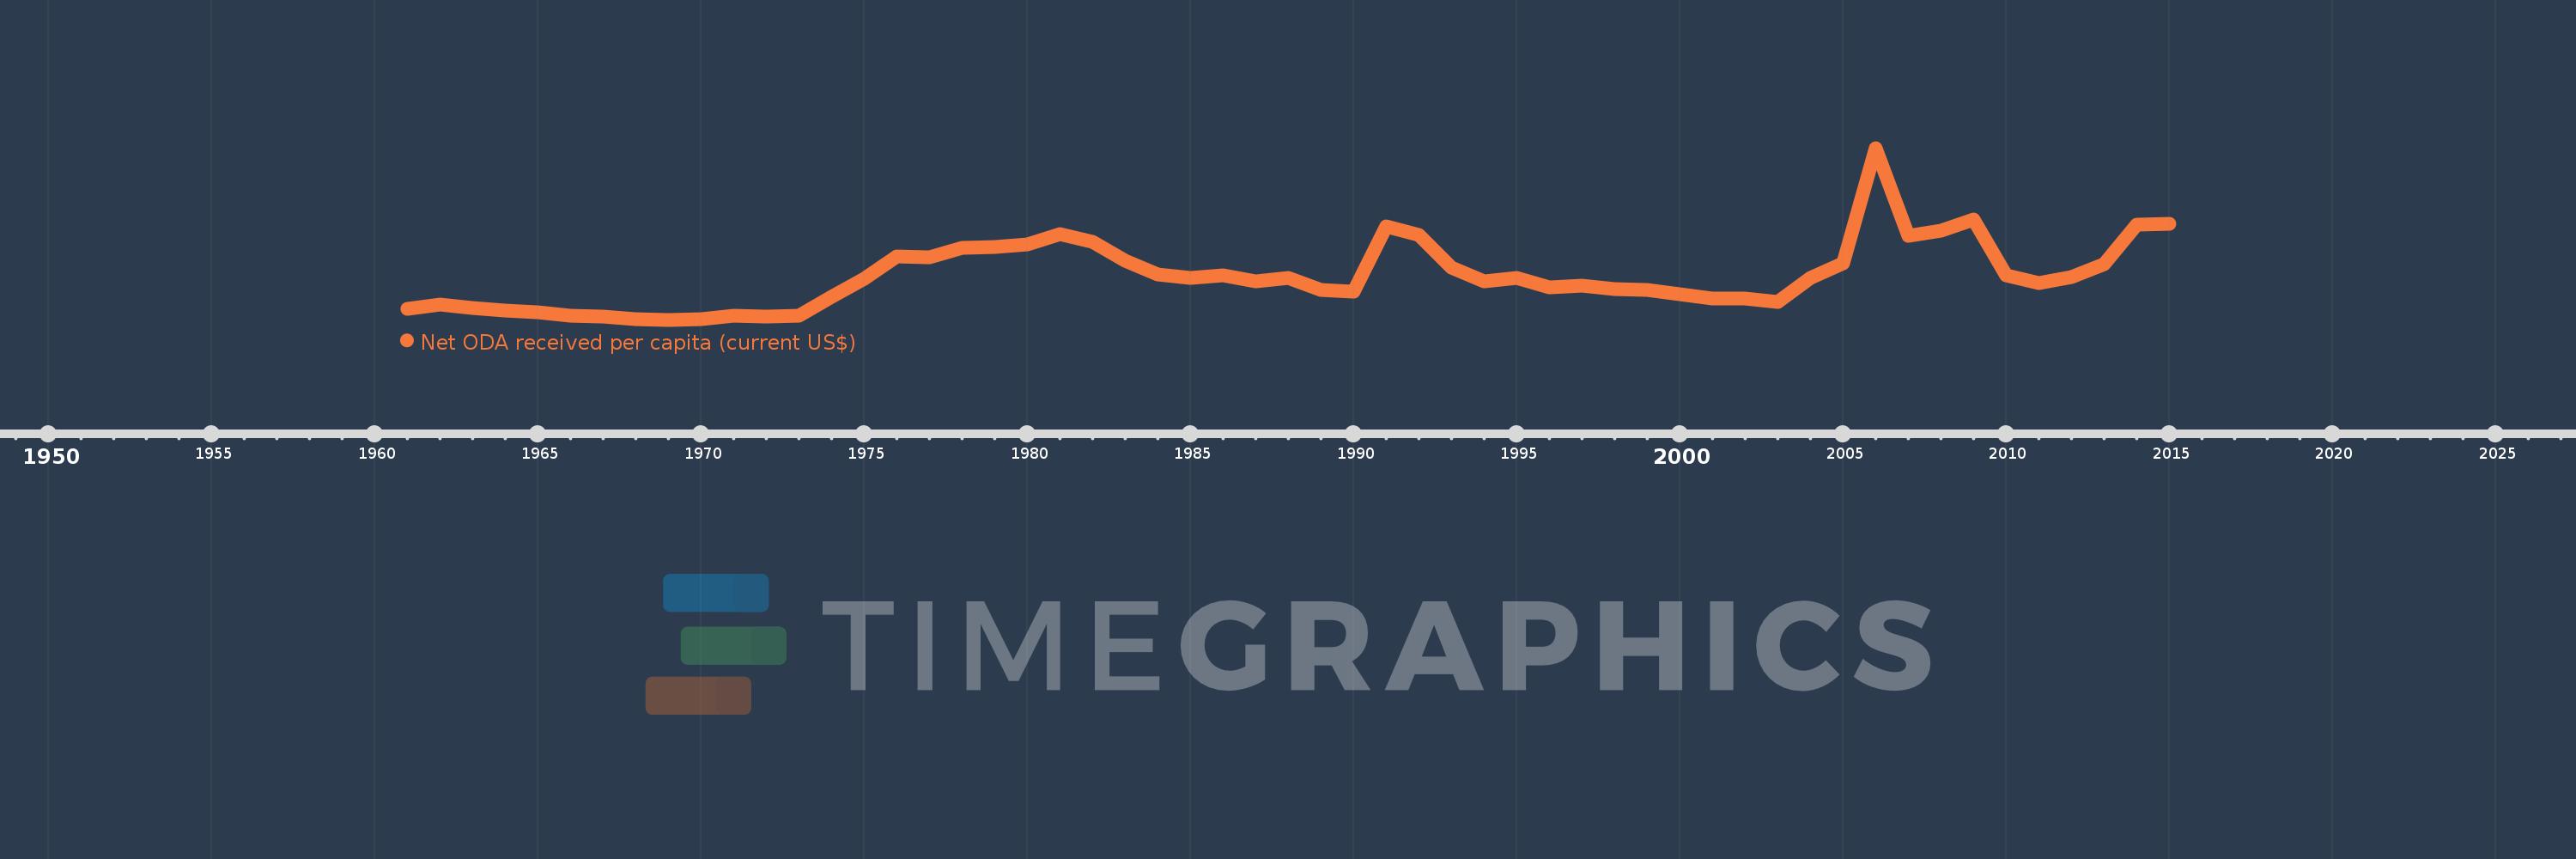
Net ODA received per capita (current US$)
2015,2014,2013,2012,2011,2010,2009,2008,2007,2006,2005,2004,2003,2002,2001,2000,1999,1998,1997,1996,1995,1994,1993,1992,1991,1990,1989,1988,1987,1986,1985,1984,1983,1982,1981,1980,1979,1978,1977,1976,1975,1974,1973,1972,1971,1970,1969,1968,1967,1966,1965,1964,1963,1962,1961
This statistics in other country:
AfghanistanAlbaniaAlgeriaAngolaAntigua and BarbudaArab WorldArgentinaArmeniaArubaAzerbaijanBahamas, TheBahrainBangladeshBarbadosBelarusBelizeBeninBermudaBhutanBoliviaBosnia and HerzegovinaBotswanaBrazilBritish Virgin IslandsBrunei DarussalamBurkina FasoBurundiCabo VerdeCambodiaCameroonCaribbean small statesCayman IslandsCentral African RepublicCentral Europe and the BalticsChadChileChinaColombiaComorosCongo, Dem. Rep.Congo, Rep.Costa RicaCote d'IvoireCroatiaCubaCyprusDjiboutiDominicaDominican RepublicEast Asia & PacificEast Asia & Pacific (excluding high income)East Asia & Pacific (IDA & IBRD countries)EcuadorEgypt, Arab Rep.El SalvadorEquatorial GuineaEritreaEthiopiaEuro areaEurope & Central AsiaEurope & Central Asia (excluding high income)Europe & Central Asia (IDA & IBRD countries)European UnionFijiFragile and conflict affected situationsFrench PolynesiaGabonGambia, TheGeorgiaGhanaGibraltarGrenadaGuatemalaGuineaGuinea-BissauGuyanaHaitiHeavily indebted poor countries (HIPC)High incomeHondurasHong Kong SAR, ChinaIBRD onlyIDA & IBRD totalIDA blendIDA onlyIDA totalIndiaIndonesiaIran, Islamic Rep.IraqIsraelJamaicaJordanKazakhstanKenyaKiribatiKorea, Dem. People’s Rep.Korea, Rep.KosovoKuwaitKyrgyz RepublicLao PDRLatin America & Caribbean Latin America & Caribbean (excluding high income)Latin America & the Caribbean (IDA & IBRD countries)Least developed countries: UN classificationLebanonLesothoLiberiaLibyaLow & middle incomeLow incomeLower middle incomeMacao SAR, ChinaMacedonia, FYRMadagascarMalawiMalaysiaMaldivesMaliMaltaMarshall IslandsMauritaniaMauritiusMexicoMicronesia, Fed. Sts.Middle East & North AfricaMiddle East & North Africa (excluding high income)Middle East & North Africa (IDA & IBRD countries)Middle incomeMoldovaMongoliaMontenegroMoroccoMozambiqueMyanmarNamibiaNauruNepalNew CaledoniaNicaraguaNigerNigeriaNorth AmericaNorthern Mariana IslandsOECD membersOmanOther small statesPacific island small statesPakistanPalauPanamaPapua New GuineaParaguayPeruPhilippinesQatarRwandaSamoaSao Tome and PrincipeSaudi ArabiaSenegalSerbiaSeychellesSierra LeoneSingaporeSloveniaSmall statesSolomon IslandsSomaliaSouth AfricaSouth AsiaSouth Asia (IDA & IBRD)South SudanSri LankaSt. Kitts and NevisSt. LuciaSt. Vincent and the GrenadinesSub-Saharan Africa Sub-Saharan Africa (excluding high income)Sub-Saharan Africa (IDA & IBRD countries)SudanSurinameSwazilandSyrian Arab RepublicTajikistanTanzaniaThailandTimor-LesteTogoTongaTrinidad and TobagoTunisiaTurkeyTurkmenistanTurks and Caicos IslandsTuvaluUgandaUkraineUnited Arab EmiratesUpper middle incomeUruguayUzbekistanVanuatuVenezuela, RBVietnamWest Bank and GazaWorldYemen, Rep.ZambiaZimbabwe Timeline:
This timeline shows a graph from 1961 to 2015 of Middle East & North Africa (IDA & IBRD countries). No data until 1960. Number of actual observations by date: 55.
Source name:
World Development Indicators
Source organization:
Development Assistance Committee of the Organisation for Economic Co-operation and Development, Geographical Distribution of Financial Flows to Developing Countries, Development Co-operation Report, and International Development Statistics database. Data are available online at: www.oecd.org/dac/stats/idsonline. World Bank population estimates are used for the denominator.
Categories, topics:
Aid Effectiveness, Economy & Growth, External Debt
Last updated:
apr 23, 2017
Indicators value changes by year
Maximum:
86.738
jan 1, 2006
At the date of observation
Value
Absolute change
Change from previous value
jan 1, 1961
8.694
+8.694
0.0%
jan 1, 1962
10.582
+1.887
21.71%
jan 1, 1963
9.304
-1.278
-12.07%
jan 1, 1964
7.935
-1.369
-14.72%
jan 1, 1965
7.148
-0.787
-9.91%
jan 1, 1966
5.531
-1.617
-22.62%
jan 1, 1967
4.993
-0.538
-9.73%
jan 1, 1968
3.674
-1.319
-26.41%
jan 1, 1969
3.411
-0.264
-7.18%
jan 1, 1970
3.593
+0.182
5.35%
jan 1, 1971
5.289
+1.696
47.2%
jan 1, 1972
5.042
-0.246
-4.66%
jan 1, 1973
5.562
+0.52
10.31%
jan 1, 1974
14.502
+8.94
160.72%
jan 1, 1975
23.081
+8.579
59.16%
jan 1, 1976
34.302
+11.221
48.61%
jan 1, 1977
33.544
-0.758
-2.21%
jan 1, 1978
38.288
+4.744
14.14%
jan 1, 1979
38.638
+0.35
0.91%
jan 1, 1980
40.102
+1.464
3.79%
jan 1, 1981
44.806
+4.703
11.73%
jan 1, 1982
41.316
-3.49
-7.79%
jan 1, 1983
32.032
-9.284
-22.47%
jan 1, 1984
25.246
-6.786
-21.18%
jan 1, 1985
23.834
-1.412
-5.59%
jan 1, 1986
24.792
+0.957
4.02%
jan 1, 1987
22.084
-2.708
-10.92%
jan 1, 1988
23.847
+1.764
7.99%
jan 1, 1989
17.73
-6.117
-25.65%
jan 1, 1990
17.016
-0.715
-4.03%
jan 1, 1991
48.891
+31.875
187.33%
jan 1, 1992
44.633
-4.258
-8.71%
jan 1, 1993
28.909
-15.724
-35.23%
jan 1, 1994
22.065
-6.844
-23.68%
jan 1, 1995
23.667
+1.603
7.26%
jan 1, 1996
19.111
-4.557
-19.25%
jan 1, 1997
19.95
+0.839
4.39%
jan 1, 1998
18.129
-1.821
-9.13%
jan 1, 1999
17.843
-0.286
-1.58%
jan 1, 2000
15.987
-1.856
-10.4%
jan 1, 2001
13.617
-2.37
-14.82%
jan 1, 2002
13.626
+0.009
0.07%
jan 1, 2003
12.018
-1.609
-11.8%
jan 1, 2004
23.617
+11.6
96.52%
jan 1, 2005
30.967
+7.35
31.12%
jan 1, 2006
86.738
+55.77
180.09%
jan 1, 2007
44.27
-42.468
-48.96%
jan 1, 2008
46.469
+2.199
4.97%
jan 1, 2009
52.065
+5.596
12.04%
jan 1, 2010
24.959
-27.107
-52.06%
jan 1, 2011
21.234
-3.724
-14.92%
jan 1, 2012
24.022
+2.788
13.13%
jan 1, 2013
30.505
+6.483
26.99%
jan 1, 2014
49.354
+18.849
61.79%
jan 1, 2015
49.897
+0.543
1.1%
Ranking of countries by current statistics by years


Comments: