29
/
en
AIzaSyAYiBZKx7MnpbEhh9jyipgxe19OcubqV5w
April 1, 2024
210771
Nicaragua
NIC
true
2
1
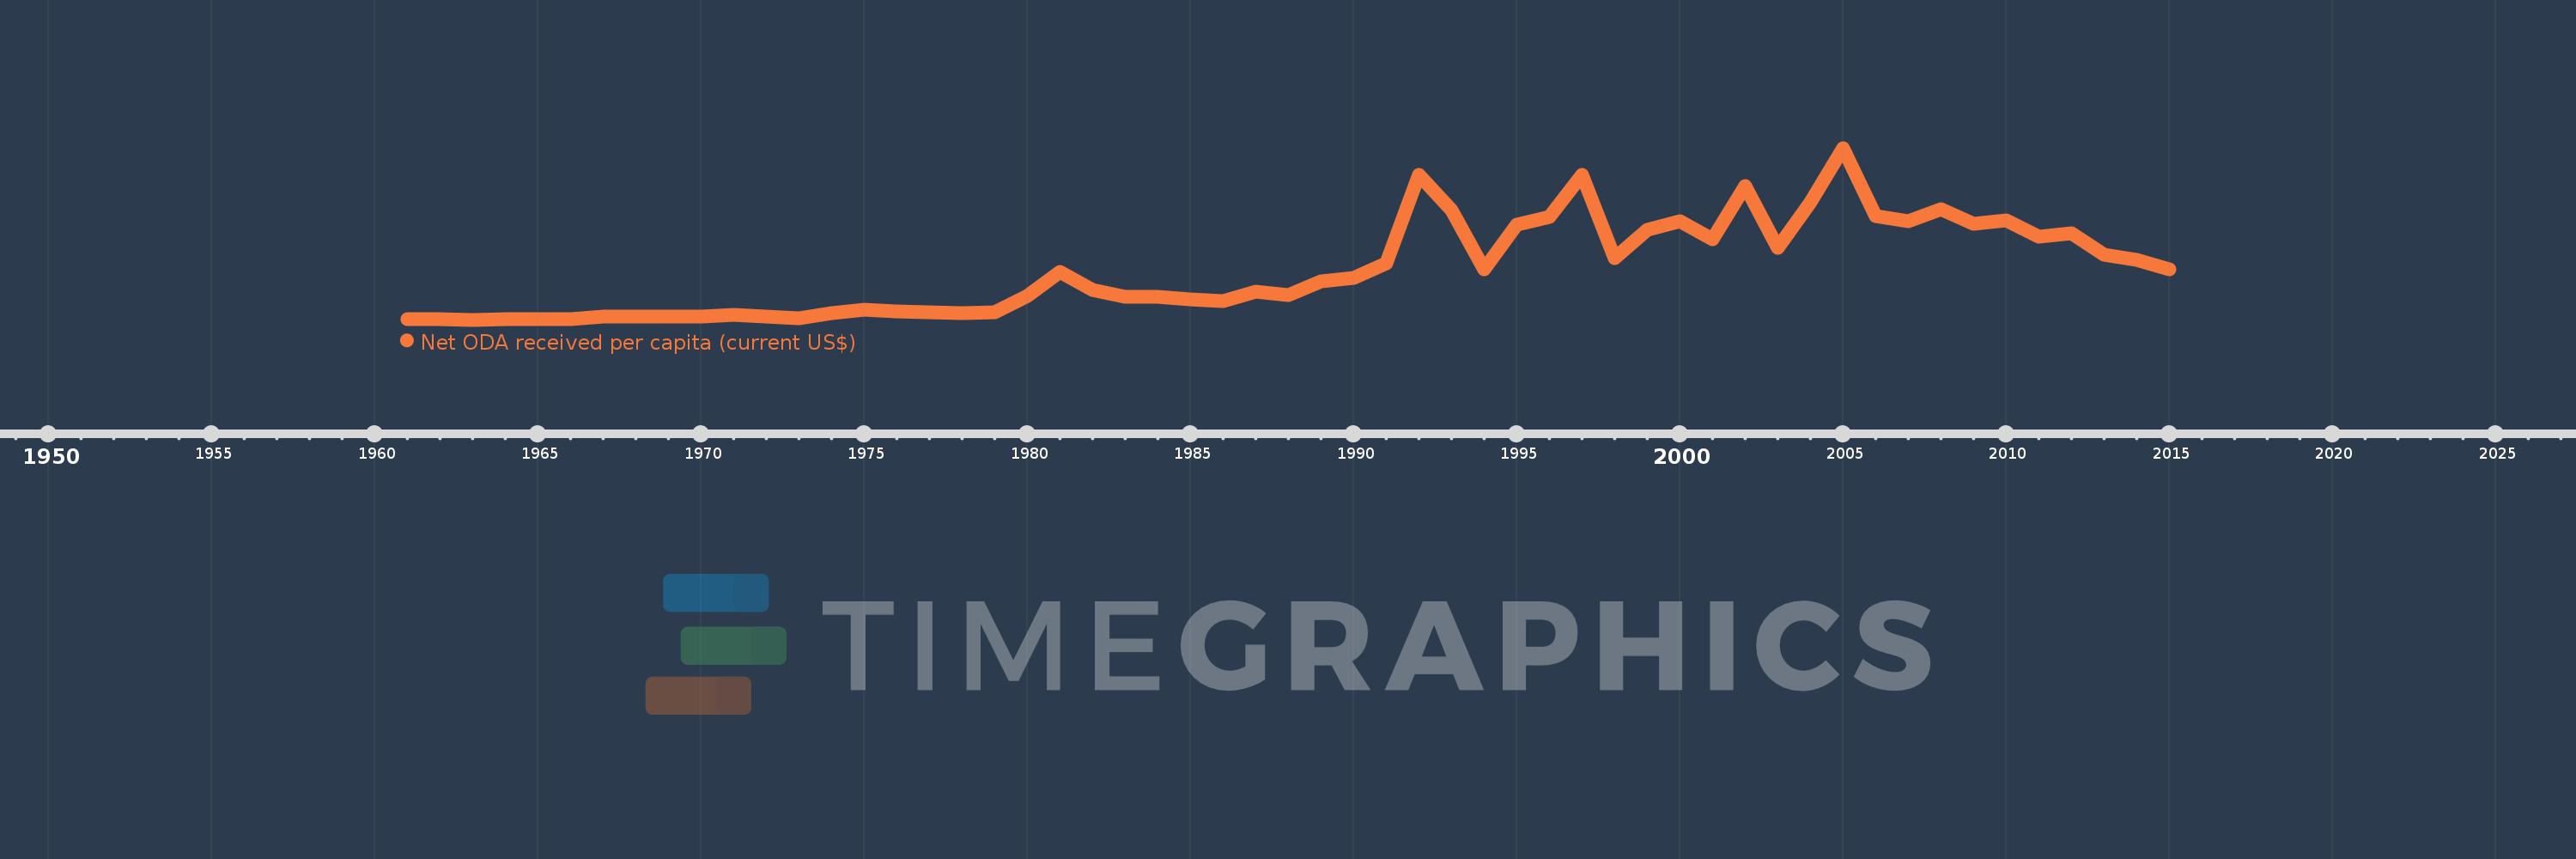
Net ODA received per capita (current US$)
2015,2014,2013,2012,2011,2010,2009,2008,2007,2006,2005,2004,2003,2002,2001,2000,1999,1998,1997,1996,1995,1994,1993,1992,1991,1990,1989,1988,1987,1986,1985,1984,1983,1982,1981,1980,1979,1978,1977,1976,1975,1974,1973,1972,1971,1970,1969,1968,1967,1966,1965,1964,1963,1962,1961
This statistics in other country:
AfghanistanAlbaniaAlgeriaAngolaAntigua and BarbudaArab WorldArgentinaArmeniaArubaAzerbaijanBahamas, TheBahrainBangladeshBarbadosBelarusBelizeBeninBermudaBhutanBoliviaBosnia and HerzegovinaBotswanaBrazilBritish Virgin IslandsBrunei DarussalamBurkina FasoBurundiCabo VerdeCambodiaCameroonCaribbean small statesCayman IslandsCentral African RepublicCentral Europe and the BalticsChadChileChinaColombiaComorosCongo, Dem. Rep.Congo, Rep.Costa RicaCote d'IvoireCroatiaCubaCyprusDjiboutiDominicaDominican RepublicEast Asia & PacificEast Asia & Pacific (excluding high income)East Asia & Pacific (IDA & IBRD countries)EcuadorEgypt, Arab Rep.El SalvadorEquatorial GuineaEritreaEthiopiaEuro areaEurope & Central AsiaEurope & Central Asia (excluding high income)Europe & Central Asia (IDA & IBRD countries)European UnionFijiFragile and conflict affected situationsFrench PolynesiaGabonGambia, TheGeorgiaGhanaGibraltarGrenadaGuatemalaGuineaGuinea-BissauGuyanaHaitiHeavily indebted poor countries (HIPC)High incomeHondurasHong Kong SAR, ChinaIBRD onlyIDA & IBRD totalIDA blendIDA onlyIDA totalIndiaIndonesiaIran, Islamic Rep.IraqIsraelJamaicaJordanKazakhstanKenyaKiribatiKorea, Dem. People’s Rep.Korea, Rep.KosovoKuwaitKyrgyz RepublicLao PDRLatin America & Caribbean Latin America & Caribbean (excluding high income)Latin America & the Caribbean (IDA & IBRD countries)Least developed countries: UN classificationLebanonLesothoLiberiaLibyaLow & middle incomeLow incomeLower middle incomeMacao SAR, ChinaMacedonia, FYRMadagascarMalawiMalaysiaMaldivesMaliMaltaMarshall IslandsMauritaniaMauritiusMexicoMicronesia, Fed. Sts.Middle East & North AfricaMiddle East & North Africa (excluding high income)Middle East & North Africa (IDA & IBRD countries)Middle incomeMoldovaMongoliaMontenegroMoroccoMozambiqueMyanmarNamibiaNauruNepalNew CaledoniaNicaraguaNigerNigeriaNorth AmericaNorthern Mariana IslandsOECD membersOmanOther small statesPacific island small statesPakistanPalauPanamaPapua New GuineaParaguayPeruPhilippinesQatarRwandaSamoaSao Tome and PrincipeSaudi ArabiaSenegalSerbiaSeychellesSierra LeoneSingaporeSloveniaSmall statesSolomon IslandsSomaliaSouth AfricaSouth AsiaSouth Asia (IDA & IBRD)South SudanSri LankaSt. Kitts and NevisSt. LuciaSt. Vincent and the GrenadinesSub-Saharan Africa Sub-Saharan Africa (excluding high income)Sub-Saharan Africa (IDA & IBRD countries)SudanSurinameSwazilandSyrian Arab RepublicTajikistanTanzaniaThailandTimor-LesteTogoTongaTrinidad and TobagoTunisiaTurkeyTurkmenistanTurks and Caicos IslandsTuvaluUgandaUkraineUnited Arab EmiratesUpper middle incomeUruguayUzbekistanVanuatuVenezuela, RBVietnamWest Bank and GazaWorldYemen, Rep.ZambiaZimbabwe Timeline:
This timeline shows a graph from 1961 to 2015 of Nicaragua. No data until 1960. Number of actual observations by date: 55.
Source name:
World Development Indicators
Source organization:
Development Assistance Committee of the Organisation for Economic Co-operation and Development, Geographical Distribution of Financial Flows to Developing Countries, Development Co-operation Report, and International Development Statistics database. Data are available online at: www.oecd.org/dac/stats/idsonline. World Bank population estimates are used for the denominator.
Categories, topics:
Aid Effectiveness, Economy & Growth, External Debt
Last updated:
apr 23, 2017
Indicators value changes by year
Maximum:
233.578
jan 1, 2005
At the date of observation
Value
Absolute change
Change from previous value
jan 1, 1961
4.339
+4.339
0.0%
jan 1, 1962
4.556
+0.218
5.02%
jan 1, 1963
3.763
-0.793
-17.4%
jan 1, 1964
4.09
+0.327
8.69%
jan 1, 1965
4.635
+0.545
13.32%
jan 1, 1966
5.066
+0.431
9.3%
jan 1, 1967
7.834
+2.768
54.64%
jan 1, 1968
7.521
-0.313
-4.0%
jan 1, 1969
7.475
-0.046
-0.61%
jan 1, 1970
7.936
+0.461
6.16%
jan 1, 1971
9.904
+1.968
24.8%
jan 1, 1972
7.793
-2.11
-21.31%
jan 1, 1973
5.326
-2.467
-31.66%
jan 1, 1974
12.584
+7.258
136.28%
jan 1, 1975
17.217
+4.633
36.82%
jan 1, 1976
14.792
-2.425
-14.08%
jan 1, 1977
13.536
-1.256
-8.49%
jan 1, 1978
12.233
-1.303
-9.62%
jan 1, 1979
13.474
+1.241
10.14%
jan 1, 1980
35.964
+22.489
166.91%
jan 1, 1981
67.217
+31.254
86.9%
jan 1, 1982
43.361
-23.857
-35.49%
jan 1, 1983
34.932
-8.429
-19.44%
jan 1, 1984
33.958
-0.975
-2.79%
jan 1, 1985
31.39
-2.567
-7.56%
jan 1, 1986
29.172
-2.219
-7.07%
jan 1, 1987
41.455
+12.283
42.11%
jan 1, 1988
37.178
-4.277
-10.32%
jan 1, 1989
55.377
+18.199
48.95%
jan 1, 1990
59.713
+4.336
7.83%
jan 1, 1991
79.516
+19.804
33.16%
jan 1, 1992
197.08
+117.564
147.85%
jan 1, 1993
150.849
-46.231
-23.46%
jan 1, 1994
71.109
-79.74
-52.86%
jan 1, 1995
131.452
+60.343
84.86%
jan 1, 1996
140.741
+9.289
7.07%
jan 1, 1997
198.023
+57.282
40.7%
jan 1, 1998
85.891
-112.131
-56.63%
jan 1, 1999
123.689
+37.798
44.01%
jan 1, 2000
135.838
+12.148
9.82%
jan 1, 2001
111.477
-24.361
-17.93%
jan 1, 2002
182.514
+71.038
63.72%
jan 1, 2003
99.999
-82.515
-45.21%
jan 1, 2004
160.777
+60.777
60.78%
jan 1, 2005
233.578
+72.801
45.28%
jan 1, 2006
141.908
-91.67
-39.25%
jan 1, 2007
135.813
-6.095
-4.3%
jan 1, 2008
152.134
+16.321
12.02%
jan 1, 2009
132.401
-19.733
-12.97%
jan 1, 2010
136.348
+3.947
2.98%
jan 1, 2011
115.434
-20.914
-15.34%
jan 1, 2012
119.209
+3.775
3.27%
jan 1, 2013
90.481
-28.728
-24.1%
jan 1, 2014
83.513
-6.968
-7.7%
jan 1, 2015
71.561
-11.952
-14.31%
Ranking of countries by current statistics by years


Comments: