29
/
en
AIzaSyAYiBZKx7MnpbEhh9jyipgxe19OcubqV5w
April 1, 2024
215611
Oman
OMN
true
2
1
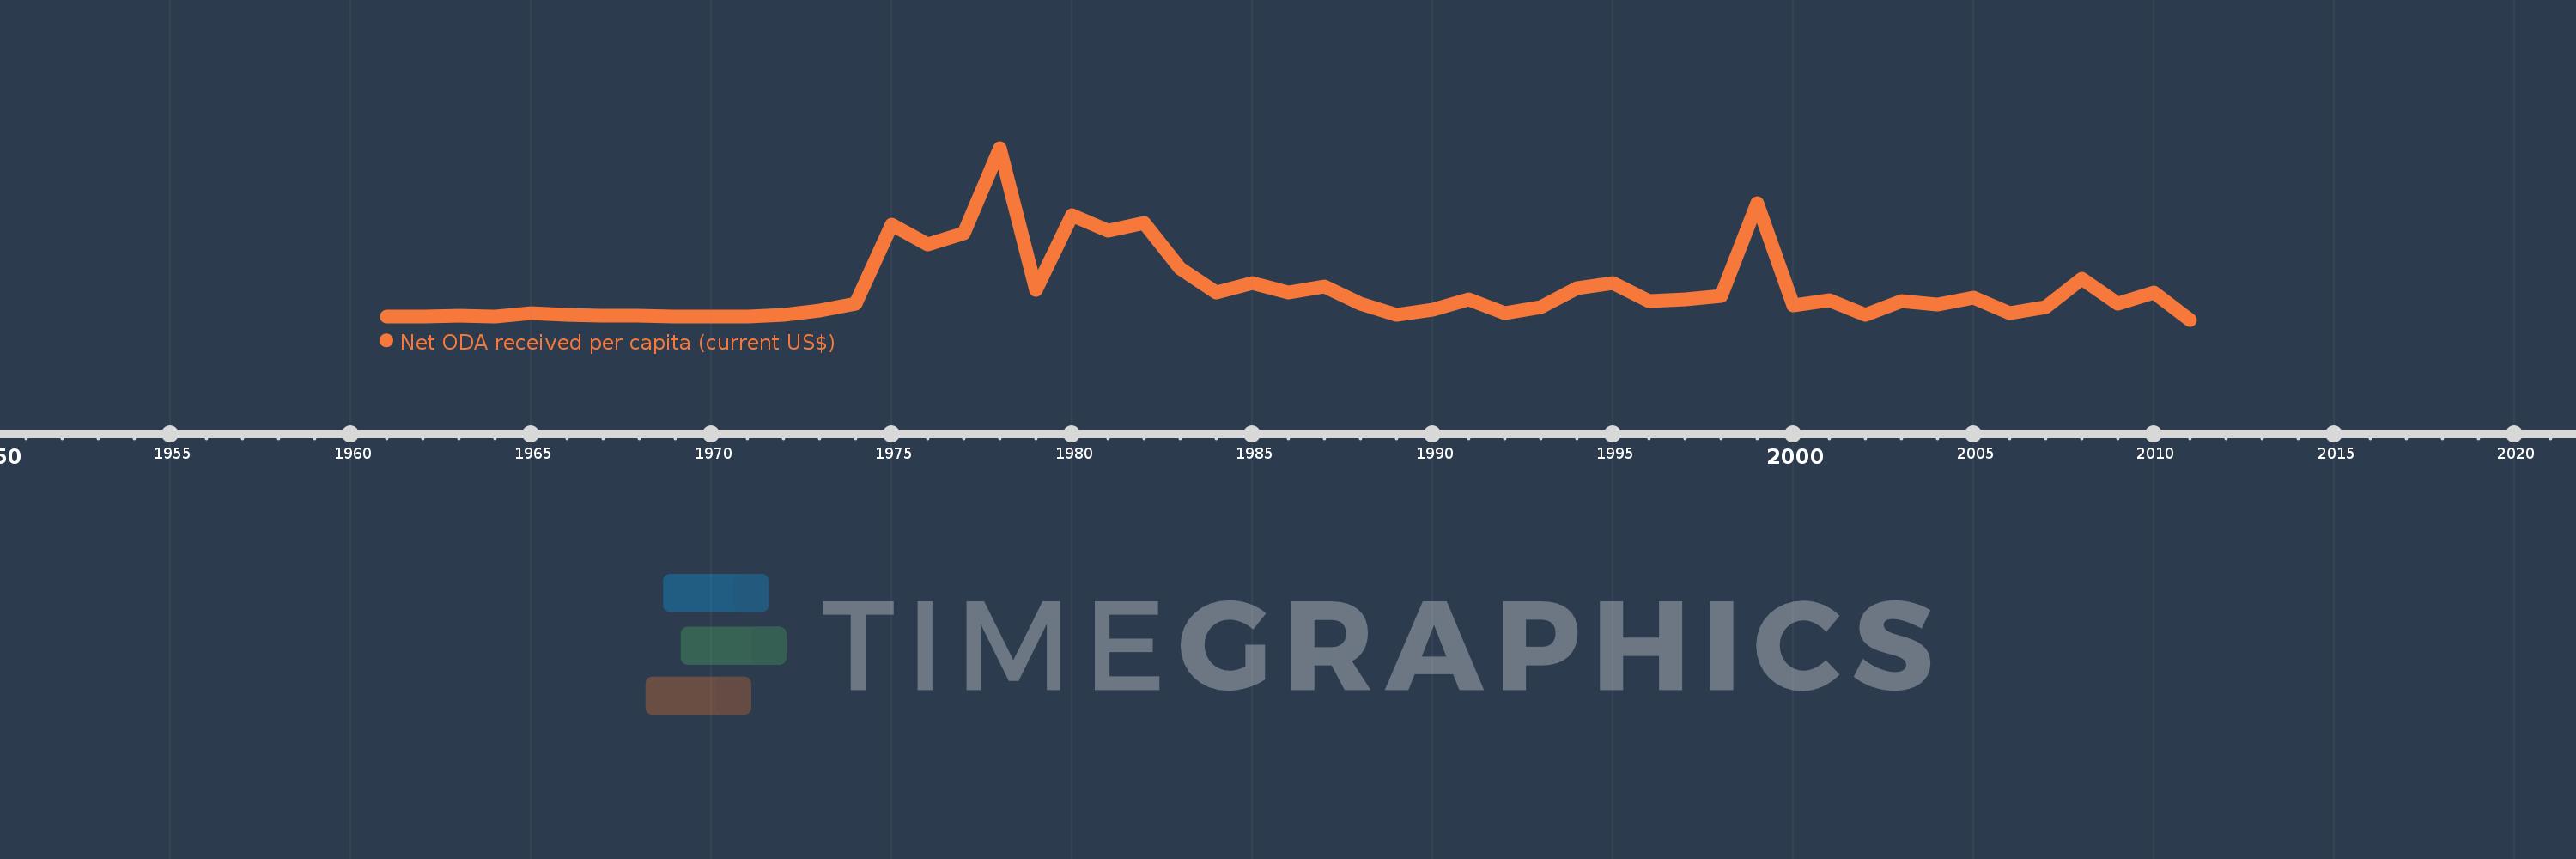
Net ODA received per capita (current US$)
2011,2010,2009,2008,2007,2006,2005,2004,2003,2002,2001,2000,1999,1998,1997,1996,1995,1994,1993,1992,1991,1990,1989,1988,1987,1986,1985,1984,1983,1982,1981,1980,1979,1978,1977,1976,1975,1974,1973,1972,1971,1970,1969,1968,1967,1966,1965,1964,1963,1962,1961
This statistics in other country:
AfghanistanAlbaniaAlgeriaAngolaAntigua and BarbudaArab WorldArgentinaArmeniaArubaAzerbaijanBahamas, TheBahrainBangladeshBarbadosBelarusBelizeBeninBermudaBhutanBoliviaBosnia and HerzegovinaBotswanaBrazilBritish Virgin IslandsBrunei DarussalamBurkina FasoBurundiCabo VerdeCambodiaCameroonCaribbean small statesCayman IslandsCentral African RepublicCentral Europe and the BalticsChadChileChinaColombiaComorosCongo, Dem. Rep.Congo, Rep.Costa RicaCote d'IvoireCroatiaCubaCyprusDjiboutiDominicaDominican RepublicEast Asia & PacificEast Asia & Pacific (excluding high income)East Asia & Pacific (IDA & IBRD countries)EcuadorEgypt, Arab Rep.El SalvadorEquatorial GuineaEritreaEthiopiaEuro areaEurope & Central AsiaEurope & Central Asia (excluding high income)Europe & Central Asia (IDA & IBRD countries)European UnionFijiFragile and conflict affected situationsFrench PolynesiaGabonGambia, TheGeorgiaGhanaGibraltarGrenadaGuatemalaGuineaGuinea-BissauGuyanaHaitiHeavily indebted poor countries (HIPC)High incomeHondurasHong Kong SAR, ChinaIBRD onlyIDA & IBRD totalIDA blendIDA onlyIDA totalIndiaIndonesiaIran, Islamic Rep.IraqIsraelJamaicaJordanKazakhstanKenyaKiribatiKorea, Dem. People’s Rep.Korea, Rep.KosovoKuwaitKyrgyz RepublicLao PDRLatin America & Caribbean Latin America & Caribbean (excluding high income)Latin America & the Caribbean (IDA & IBRD countries)Least developed countries: UN classificationLebanonLesothoLiberiaLibyaLow & middle incomeLow incomeLower middle incomeMacao SAR, ChinaMacedonia, FYRMadagascarMalawiMalaysiaMaldivesMaliMaltaMarshall IslandsMauritaniaMauritiusMexicoMicronesia, Fed. Sts.Middle East & North AfricaMiddle East & North Africa (excluding high income)Middle East & North Africa (IDA & IBRD countries)Middle incomeMoldovaMongoliaMontenegroMoroccoMozambiqueMyanmarNamibiaNauruNepalNew CaledoniaNicaraguaNigerNigeriaNorth AmericaNorthern Mariana IslandsOECD membersOmanOther small statesPacific island small statesPakistanPalauPanamaPapua New GuineaParaguayPeruPhilippinesQatarRwandaSamoaSao Tome and PrincipeSaudi ArabiaSenegalSerbiaSeychellesSierra LeoneSingaporeSloveniaSmall statesSolomon IslandsSomaliaSouth AfricaSouth AsiaSouth Asia (IDA & IBRD)South SudanSri LankaSt. Kitts and NevisSt. LuciaSt. Vincent and the GrenadinesSub-Saharan Africa Sub-Saharan Africa (excluding high income)Sub-Saharan Africa (IDA & IBRD countries)SudanSurinameSwazilandSyrian Arab RepublicTajikistanTanzaniaThailandTimor-LesteTogoTongaTrinidad and TobagoTunisiaTurkeyTurkmenistanTurks and Caicos IslandsTuvaluUgandaUkraineUnited Arab EmiratesUpper middle incomeUruguayUzbekistanVanuatuVenezuela, RBVietnamWest Bank and GazaWorldYemen, Rep.ZambiaZimbabwe Timeline:
This timeline shows a graph from 1961 to 2011 of Oman. No data until 1960. Number of actual observations by date: 51.
Source name:
World Development Indicators
Source organization:
Development Assistance Committee of the Organisation for Economic Co-operation and Development, Geographical Distribution of Financial Flows to Developing Countries, Development Co-operation Report, and International Development Statistics database. Data are available online at: www.oecd.org/dac/stats/idsonline. World Bank population estimates are used for the denominator.
Categories, topics:
Aid Effectiveness, Economy & Growth, External Debt
Last updated:
apr 23, 2017
Indicators value changes by year
Minimum:
-7.341
jan 1, 2011
Maximum:
371.495
jan 1, 1978
At the date of observation
Value
Absolute change
Change from previous value
jan 1, 1961
0.453
+0.453
0.0%
jan 1, 1962
0.584
+0.131
28.93%
jan 1, 1963
0.76
+0.176
30.12%
jan 1, 1964
0.607
-0.154
-20.21%
jan 1, 1965
6.668
+6.061
999.28%
jan 1, 1966
2.944
-3.724
-55.85%
jan 1, 1967
0.966
-1.978
-67.2%
jan 1, 1968
1.424
+0.458
47.45%
jan 1, 1969
0.074
-1.35
-94.83%
jan 1, 1970
0.057
-0.016
-22.41%
jan 1, 1971
0.097
+0.04
69.41%
jan 1, 1972
2.724
+2.627
2.72K%
jan 1, 1973
12.7
+9.976
366.27%
jan 1, 1974
27.931
+15.231
119.93%
jan 1, 1975
201.473
+173.543
621.33%
jan 1, 1976
158.87
-42.604
-21.15%
jan 1, 1977
183.775
+24.905
15.68%
jan 1, 1978
371.495
+187.72
102.15%
jan 1, 1979
58.695
-312.8
-84.2%
jan 1, 1980
223.326
+164.631
280.49%
jan 1, 1981
189.999
-33.327
-14.92%
jan 1, 1982
206.465
+16.466
8.67%
jan 1, 1983
105.844
-100.62
-48.73%
jan 1, 1984
52.34
-53.505
-50.55%
jan 1, 1985
74.378
+22.039
42.11%
jan 1, 1986
51.775
-22.604
-30.39%
jan 1, 1987
66.507
+14.732
28.45%
jan 1, 1988
27.719
-38.788
-58.32%
jan 1, 1989
3.037
-24.681
-89.04%
jan 1, 1990
14.174
+11.136
366.64%
jan 1, 1991
37.635
+23.461
165.53%
jan 1, 1992
6.917
-30.717
-81.62%
jan 1, 1993
20.016
+13.099
189.36%
jan 1, 1994
62.761
+42.745
213.55%
jan 1, 1995
72.665
+9.905
15.78%
jan 1, 1996
34.259
-38.407
-52.85%
jan 1, 1997
37.36
+3.101
9.05%
jan 1, 1998
45.071
+7.711
20.64%
jan 1, 1999
249.78
+204.709
454.19%
jan 1, 2000
23.882
-225.897
-90.44%
jan 1, 2001
35.576
+11.694
48.96%
jan 1, 2002
3.657
-31.92
-89.72%
jan 1, 2003
33.325
+29.668
811.33%
jan 1, 2004
26.964
-6.361
-19.09%
jan 1, 2005
41.169
+14.206
52.68%
jan 1, 2006
7.595
-33.574
-81.55%
jan 1, 2007
21.176
+13.581
178.81%
jan 1, 2008
82.498
+61.322
289.59%
jan 1, 2009
28.146
-54.353
-65.88%
jan 1, 2010
52.312
+24.167
85.86%
jan 1, 2011
-7.341
-59.653
-114.03%
Ranking of countries by current statistics by years


Comments: