29
/
en
AIzaSyAYiBZKx7MnpbEhh9jyipgxe19OcubqV5w
April 1, 2024
61036
Sub-Saharan Africa (IDA & IBRD countries)
TSS
false
2
1
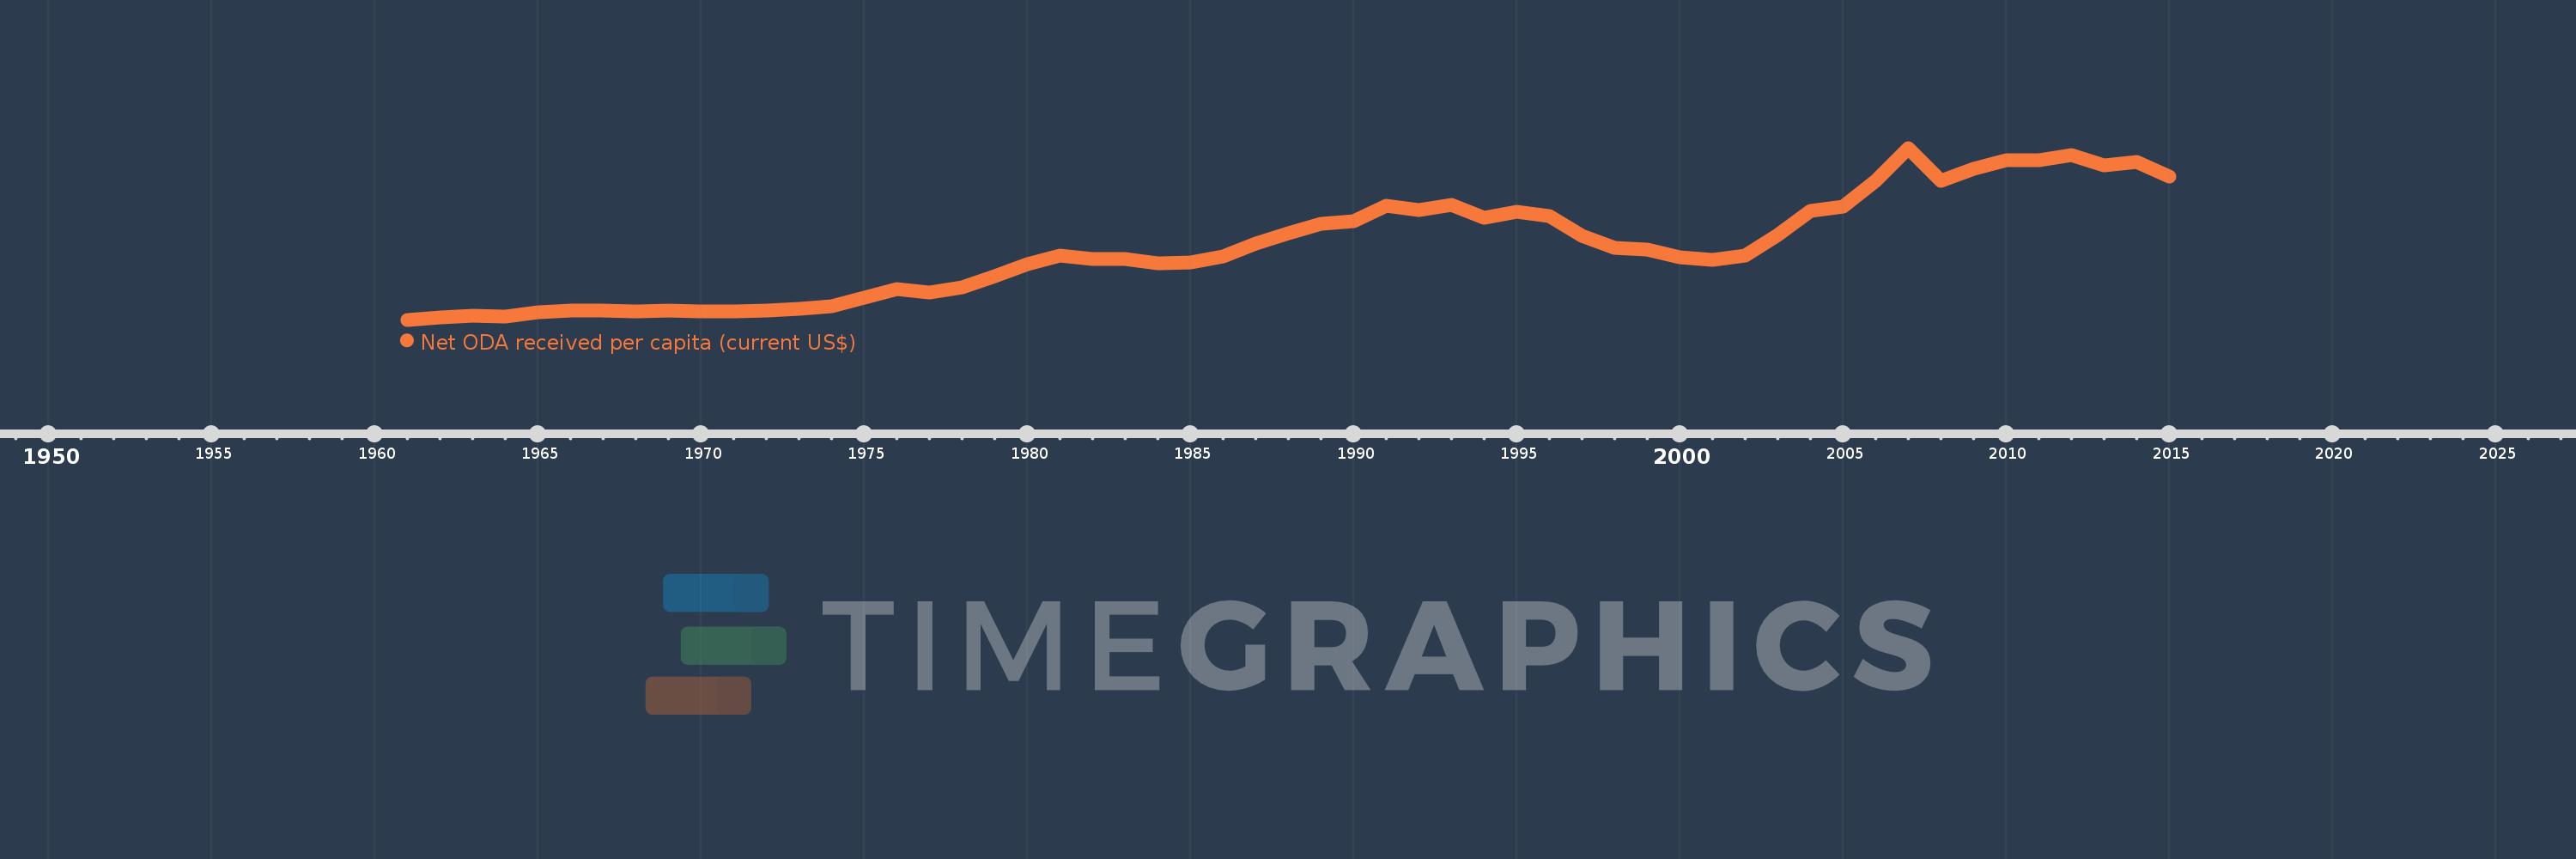
Net ODA received per capita (current US$)
2015,2014,2013,2012,2011,2010,2009,2008,2007,2006,2005,2004,2003,2002,2001,2000,1999,1998,1997,1996,1995,1994,1993,1992,1991,1990,1989,1988,1987,1986,1985,1984,1983,1982,1981,1980,1979,1978,1977,1976,1975,1974,1973,1972,1971,1970,1969,1968,1967,1966,1965,1964,1963,1962,1961
This statistics in other country:
AfghanistanAlbaniaAlgeriaAngolaAntigua and BarbudaArab WorldArgentinaArmeniaArubaAzerbaijanBahamas, TheBahrainBangladeshBarbadosBelarusBelizeBeninBermudaBhutanBoliviaBosnia and HerzegovinaBotswanaBrazilBritish Virgin IslandsBrunei DarussalamBurkina FasoBurundiCabo VerdeCambodiaCameroonCaribbean small statesCayman IslandsCentral African RepublicCentral Europe and the BalticsChadChileChinaColombiaComorosCongo, Dem. Rep.Congo, Rep.Costa RicaCote d'IvoireCroatiaCubaCyprusDjiboutiDominicaDominican RepublicEast Asia & PacificEast Asia & Pacific (excluding high income)East Asia & Pacific (IDA & IBRD countries)EcuadorEgypt, Arab Rep.El SalvadorEquatorial GuineaEritreaEthiopiaEuro areaEurope & Central AsiaEurope & Central Asia (excluding high income)Europe & Central Asia (IDA & IBRD countries)European UnionFijiFragile and conflict affected situationsFrench PolynesiaGabonGambia, TheGeorgiaGhanaGibraltarGrenadaGuatemalaGuineaGuinea-BissauGuyanaHaitiHeavily indebted poor countries (HIPC)High incomeHondurasHong Kong SAR, ChinaIBRD onlyIDA & IBRD totalIDA blendIDA onlyIDA totalIndiaIndonesiaIran, Islamic Rep.IraqIsraelJamaicaJordanKazakhstanKenyaKiribatiKorea, Dem. People’s Rep.Korea, Rep.KosovoKuwaitKyrgyz RepublicLao PDRLatin America & Caribbean Latin America & Caribbean (excluding high income)Latin America & the Caribbean (IDA & IBRD countries)Least developed countries: UN classificationLebanonLesothoLiberiaLibyaLow & middle incomeLow incomeLower middle incomeMacao SAR, ChinaMacedonia, FYRMadagascarMalawiMalaysiaMaldivesMaliMaltaMarshall IslandsMauritaniaMauritiusMexicoMicronesia, Fed. Sts.Middle East & North AfricaMiddle East & North Africa (excluding high income)Middle East & North Africa (IDA & IBRD countries)Middle incomeMoldovaMongoliaMontenegroMoroccoMozambiqueMyanmarNamibiaNauruNepalNew CaledoniaNicaraguaNigerNigeriaNorth AmericaNorthern Mariana IslandsOECD membersOmanOther small statesPacific island small statesPakistanPalauPanamaPapua New GuineaParaguayPeruPhilippinesQatarRwandaSamoaSao Tome and PrincipeSaudi ArabiaSenegalSerbiaSeychellesSierra LeoneSingaporeSloveniaSmall statesSolomon IslandsSomaliaSouth AfricaSouth AsiaSouth Asia (IDA & IBRD)South SudanSri LankaSt. Kitts and NevisSt. LuciaSt. Vincent and the GrenadinesSub-Saharan Africa Sub-Saharan Africa (excluding high income)Sub-Saharan Africa (IDA & IBRD countries)SudanSurinameSwazilandSyrian Arab RepublicTajikistanTanzaniaThailandTimor-LesteTogoTongaTrinidad and TobagoTunisiaTurkeyTurkmenistanTurks and Caicos IslandsTuvaluUgandaUkraineUnited Arab EmiratesUpper middle incomeUruguayUzbekistanVanuatuVenezuela, RBVietnamWest Bank and GazaWorldYemen, Rep.ZambiaZimbabwe Timeline:
This timeline shows a graph from 1961 to 2015 of Sub-Saharan Africa (IDA & IBRD countries). No data until 1960. Number of actual observations by date: 55.
Source name:
World Development Indicators
Source organization:
Development Assistance Committee of the Organisation for Economic Co-operation and Development, Geographical Distribution of Financial Flows to Developing Countries, Development Co-operation Report, and International Development Statistics database. Data are available online at: www.oecd.org/dac/stats/idsonline. World Bank population estimates are used for the denominator.
Categories, topics:
Aid Effectiveness, Economy & Growth, External Debt
Last updated:
apr 23, 2017
Indicators value changes by year
At the date of observation
Value
Absolute change
Change from previous value
jan 1, 1961
1.273
+1.273
0.0%
jan 1, 1962
1.981
+0.708
55.57%
jan 1, 1963
2.433
+0.451
22.79%
jan 1, 1964
2.249
-0.183
-7.53%
jan 1, 1965
3.39
+1.14
50.69%
jan 1, 1966
3.818
+0.428
12.63%
jan 1, 1967
3.901
+0.083
2.18%
jan 1, 1968
3.559
-0.342
-8.76%
jan 1, 1969
3.755
+0.196
5.51%
jan 1, 1970
3.533
-0.222
-5.91%
jan 1, 1971
3.543
+0.01
0.29%
jan 1, 1972
3.892
+0.349
9.84%
jan 1, 1973
4.225
+0.333
8.56%
jan 1, 1974
5.023
+0.798
18.87%
jan 1, 1975
7.478
+2.455
48.87%
jan 1, 1976
9.941
+2.464
32.95%
jan 1, 1977
8.969
-0.972
-9.78%
jan 1, 1978
10.3
+1.331
14.84%
jan 1, 1979
13.494
+3.194
31.01%
jan 1, 1980
16.953
+3.459
25.63%
jan 1, 1981
19.256
+2.303
13.58%
jan 1, 1982
18.272
-0.984
-5.11%
jan 1, 1983
18.368
+0.096
0.53%
jan 1, 1984
17.238
-1.131
-6.16%
jan 1, 1985
17.304
+0.066
0.38%
jan 1, 1986
19.004
+1.7
9.83%
jan 1, 1987
22.67
+3.666
19.29%
jan 1, 1988
25.454
+2.784
12.28%
jan 1, 1989
28.176
+2.722
10.7%
jan 1, 1990
28.973
+0.797
2.83%
jan 1, 1991
33.334
+4.361
15.05%
jan 1, 1992
32.032
-1.302
-3.91%
jan 1, 1993
33.489
+1.457
4.55%
jan 1, 1994
30.02
-3.469
-10.36%
jan 1, 1995
31.504
+1.484
4.94%
jan 1, 1996
30.309
-1.195
-3.79%
jan 1, 1997
24.854
-5.454
-18.0%
jan 1, 1998
21.574
-3.28
-13.2%
jan 1, 1999
21.015
-0.559
-2.59%
jan 1, 2000
18.809
-2.206
-10.5%
jan 1, 2001
17.993
-0.816
-4.34%
jan 1, 2002
19.278
+1.285
7.14%
jan 1, 2003
25.106
+5.828
30.23%
jan 1, 2004
31.906
+6.8
27.09%
jan 1, 2005
32.993
+1.087
3.41%
jan 1, 2006
40.405
+7.412
22.46%
jan 1, 2007
49.53
+9.125
22.58%
jan 1, 2008
40.323
-9.206
-18.59%
jan 1, 2009
43.774
+3.451
8.56%
jan 1, 2010
46.038
+2.264
5.17%
jan 1, 2011
46.074
+0.036
0.08%
jan 1, 2012
47.501
+1.427
3.1%
jan 1, 2013
44.533
-2.968
-6.25%
jan 1, 2014
45.643
+1.109
2.49%
jan 1, 2015
41.61
-4.033
-8.84%
Ranking of countries by current statistics by years


Comments: