29
/
en
AIzaSyAYiBZKx7MnpbEhh9jyipgxe19OcubqV5w
April 1, 2024
78643
Bangladesh
BGD
true
2
1
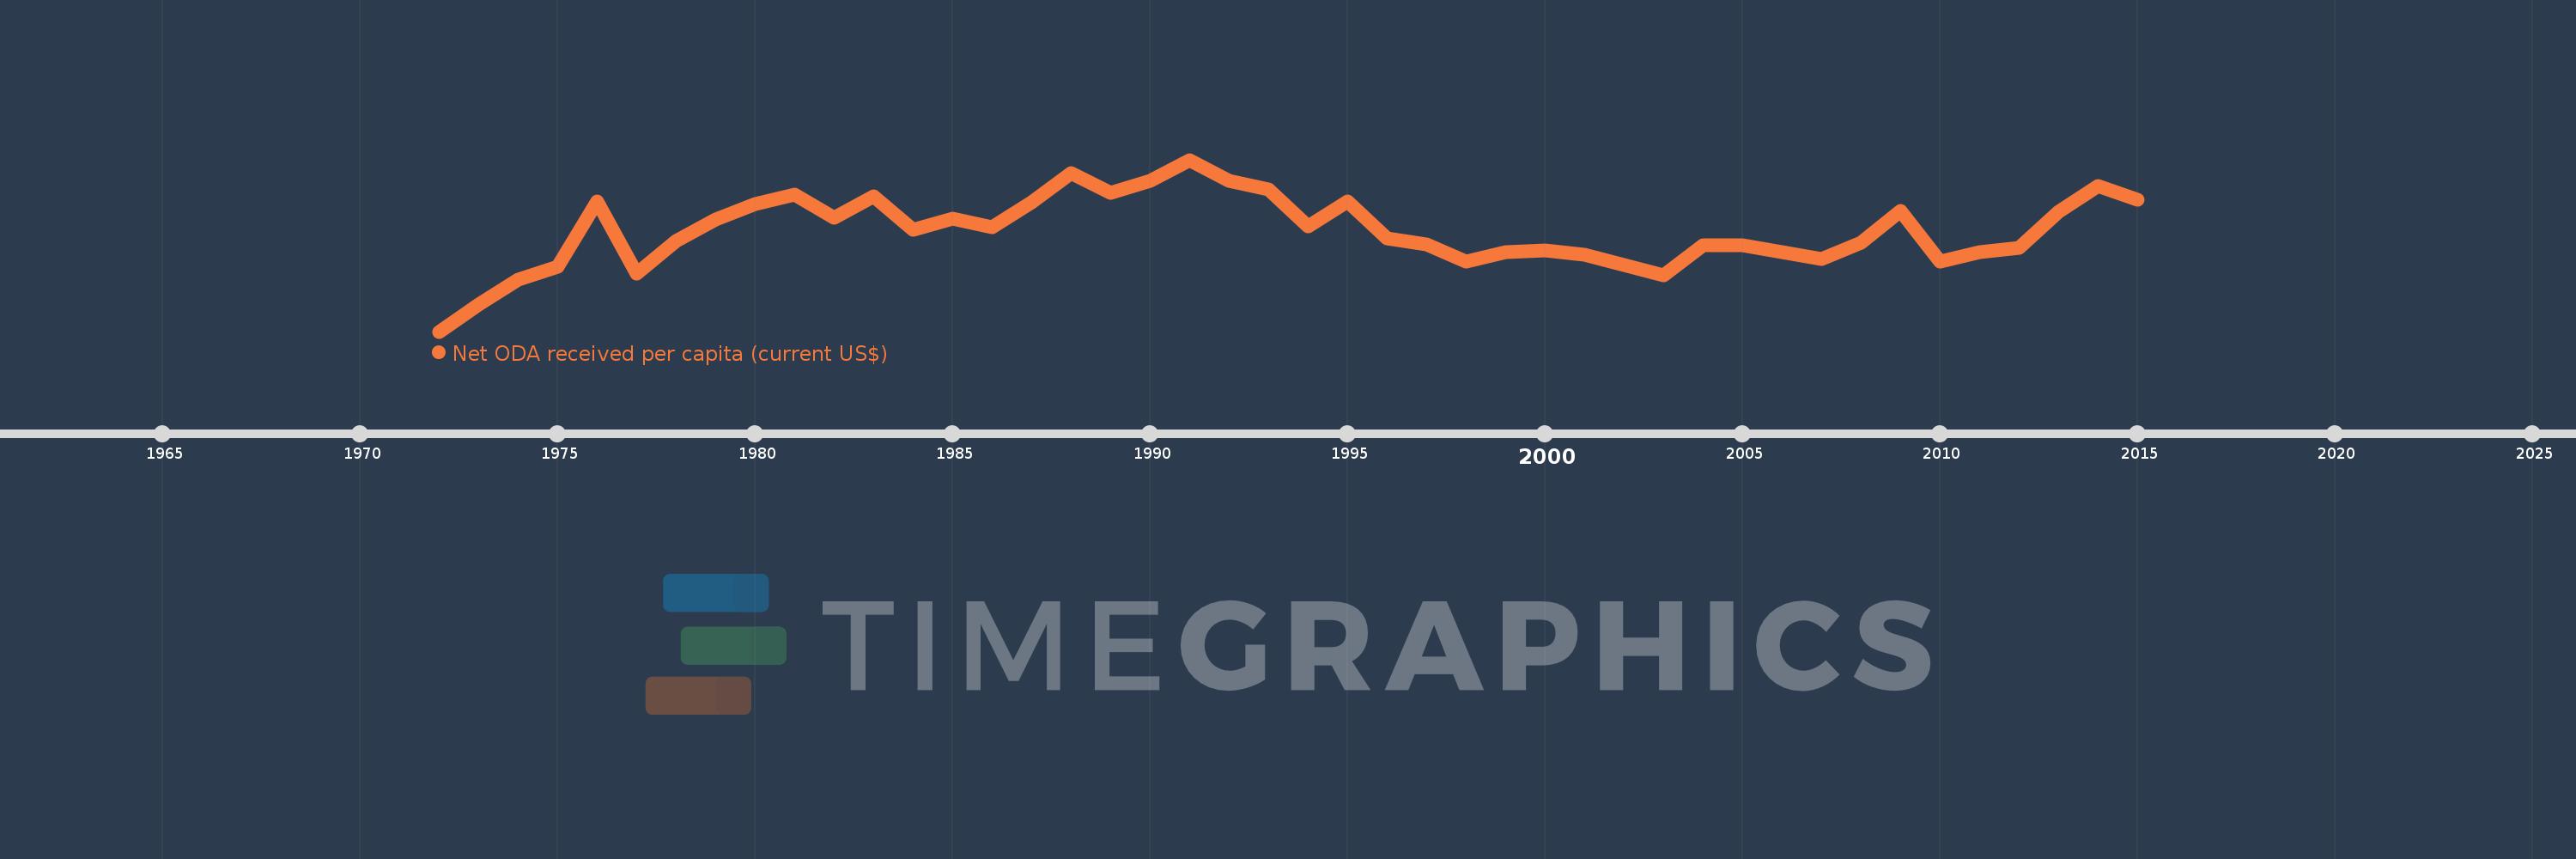
Net ODA received per capita (current US$)
2015,2014,2013,2012,2011,2010,2009,2008,2007,2006,2005,2004,2003,2002,2001,2000,1999,1998,1997,1996,1995,1994,1993,1992,1991,1990,1989,1988,1987,1986,1985,1984,1983,1982,1981,1980,1979,1978,1977,1976,1975,1974,1973,1972
This statistics in other country:
AfghanistanAlbaniaAlgeriaAngolaAntigua and BarbudaArab WorldArgentinaArmeniaArubaAzerbaijanBahamas, TheBahrainBangladeshBarbadosBelarusBelizeBeninBermudaBhutanBoliviaBosnia and HerzegovinaBotswanaBrazilBritish Virgin IslandsBrunei DarussalamBurkina FasoBurundiCabo VerdeCambodiaCameroonCaribbean small statesCayman IslandsCentral African RepublicCentral Europe and the BalticsChadChileChinaColombiaComorosCongo, Dem. Rep.Congo, Rep.Costa RicaCote d'IvoireCroatiaCubaCyprusDjiboutiDominicaDominican RepublicEast Asia & PacificEast Asia & Pacific (excluding high income)East Asia & Pacific (IDA & IBRD countries)EcuadorEgypt, Arab Rep.El SalvadorEquatorial GuineaEritreaEthiopiaEuro areaEurope & Central AsiaEurope & Central Asia (excluding high income)Europe & Central Asia (IDA & IBRD countries)European UnionFijiFragile and conflict affected situationsFrench PolynesiaGabonGambia, TheGeorgiaGhanaGibraltarGrenadaGuatemalaGuineaGuinea-BissauGuyanaHaitiHeavily indebted poor countries (HIPC)High incomeHondurasHong Kong SAR, ChinaIBRD onlyIDA & IBRD totalIDA blendIDA onlyIDA totalIndiaIndonesiaIran, Islamic Rep.IraqIsraelJamaicaJordanKazakhstanKenyaKiribatiKorea, Dem. People’s Rep.Korea, Rep.KosovoKuwaitKyrgyz RepublicLao PDRLatin America & Caribbean Latin America & Caribbean (excluding high income)Latin America & the Caribbean (IDA & IBRD countries)Least developed countries: UN classificationLebanonLesothoLiberiaLibyaLow & middle incomeLow incomeLower middle incomeMacao SAR, ChinaMacedonia, FYRMadagascarMalawiMalaysiaMaldivesMaliMaltaMarshall IslandsMauritaniaMauritiusMexicoMicronesia, Fed. Sts.Middle East & North AfricaMiddle East & North Africa (excluding high income)Middle East & North Africa (IDA & IBRD countries)Middle incomeMoldovaMongoliaMontenegroMoroccoMozambiqueMyanmarNamibiaNauruNepalNew CaledoniaNicaraguaNigerNigeriaNorth AmericaNorthern Mariana IslandsOECD membersOmanOther small statesPacific island small statesPakistanPalauPanamaPapua New GuineaParaguayPeruPhilippinesQatarRwandaSamoaSao Tome and PrincipeSaudi ArabiaSenegalSerbiaSeychellesSierra LeoneSingaporeSloveniaSmall statesSolomon IslandsSomaliaSouth AfricaSouth AsiaSouth Asia (IDA & IBRD)South SudanSri LankaSt. Kitts and NevisSt. LuciaSt. Vincent and the GrenadinesSub-Saharan Africa Sub-Saharan Africa (excluding high income)Sub-Saharan Africa (IDA & IBRD countries)SudanSurinameSwazilandSyrian Arab RepublicTajikistanTanzaniaThailandTimor-LesteTogoTongaTrinidad and TobagoTunisiaTurkeyTurkmenistanTurks and Caicos IslandsTuvaluUgandaUkraineUnited Arab EmiratesUpper middle incomeUruguayUzbekistanVanuatuVenezuela, RBVietnamWest Bank and GazaWorldYemen, Rep.ZambiaZimbabwe Timeline:
This timeline shows a graph from 1972 to 2015 of Bangladesh. No data until 1971. Number of actual observations by date: 44.
Source name:
World Development Indicators
Source organization:
Development Assistance Committee of the Organisation for Economic Co-operation and Development, Geographical Distribution of Financial Flows to Developing Countries, Development Co-operation Report, and International Development Statistics database. Data are available online at: www.oecd.org/dac/stats/idsonline. World Bank population estimates are used for the denominator.
Categories, topics:
Aid Effectiveness, Economy & Growth, External Debt
Last updated:
apr 23, 2017
Indicators value changes by year
Maximum:
19.746
jan 1, 1991
At the date of observation
Value
Absolute change
Change from previous value
jan 1, 1972
0.231
+0.231
0.0%
jan 1, 1973
3.311
+3.08
1.33K%
jan 1, 1974
6.139
+2.828
85.4%
jan 1, 1975
7.609
+1.47
23.95%
jan 1, 1976
15.041
+7.432
97.67%
jan 1, 1977
6.827
-8.214
-54.61%
jan 1, 1978
10.479
+3.652
53.5%
jan 1, 1979
12.931
+2.452
23.39%
jan 1, 1980
14.691
+1.76
13.61%
jan 1, 1981
15.814
+1.124
7.65%
jan 1, 1982
13.146
-2.668
-16.87%
jan 1, 1983
15.575
+2.429
18.47%
jan 1, 1984
11.821
-3.754
-24.1%
jan 1, 1985
13.105
+1.284
10.86%
jan 1, 1986
12.111
-0.994
-7.59%
jan 1, 1987
14.945
+2.834
23.4%
jan 1, 1988
18.264
+3.319
22.2%
jan 1, 1989
16.019
-2.245
-12.29%
jan 1, 1990
17.403
+1.384
8.64%
jan 1, 1991
19.746
+2.343
13.46%
jan 1, 1992
17.328
-2.418
-12.25%
jan 1, 1993
16.384
-0.944
-5.45%
jan 1, 1994
12.194
-4.19
-25.58%
jan 1, 1995
15.036
+2.843
23.31%
jan 1, 1996
10.823
-4.213
-28.02%
jan 1, 1997
10.15
-0.673
-6.21%
jan 1, 1998
8.192
-1.958
-19.29%
jan 1, 1999
9.217
+1.024
12.5%
jan 1, 2000
9.472
+0.255
2.77%
jan 1, 2001
8.934
-0.538
-5.68%
jan 1, 2002
7.802
-1.132
-12.67%
jan 1, 2003
6.652
-1.15
-14.74%
jan 1, 2004
10.064
+3.412
51.29%
jan 1, 2005
10.038
-0.026
-0.26%
jan 1, 2006
9.227
-0.811
-8.08%
jan 1, 2007
8.431
-0.796
-8.63%
jan 1, 2008
10.336
+1.905
22.6%
jan 1, 2009
13.967
+3.631
35.12%
jan 1, 2010
8.177
-5.79
-41.45%
jan 1, 2011
9.26
+1.082
13.24%
jan 1, 2012
9.727
+0.467
5.05%
jan 1, 2013
13.837
+4.11
42.25%
jan 1, 2014
16.728
+2.891
20.89%
jan 1, 2015
15.2
-1.528
-9.13%
Ranking of countries by current statistics by years


Comments: