29
/
en
AIzaSyAYiBZKx7MnpbEhh9jyipgxe19OcubqV5w
April 1, 2024
44509
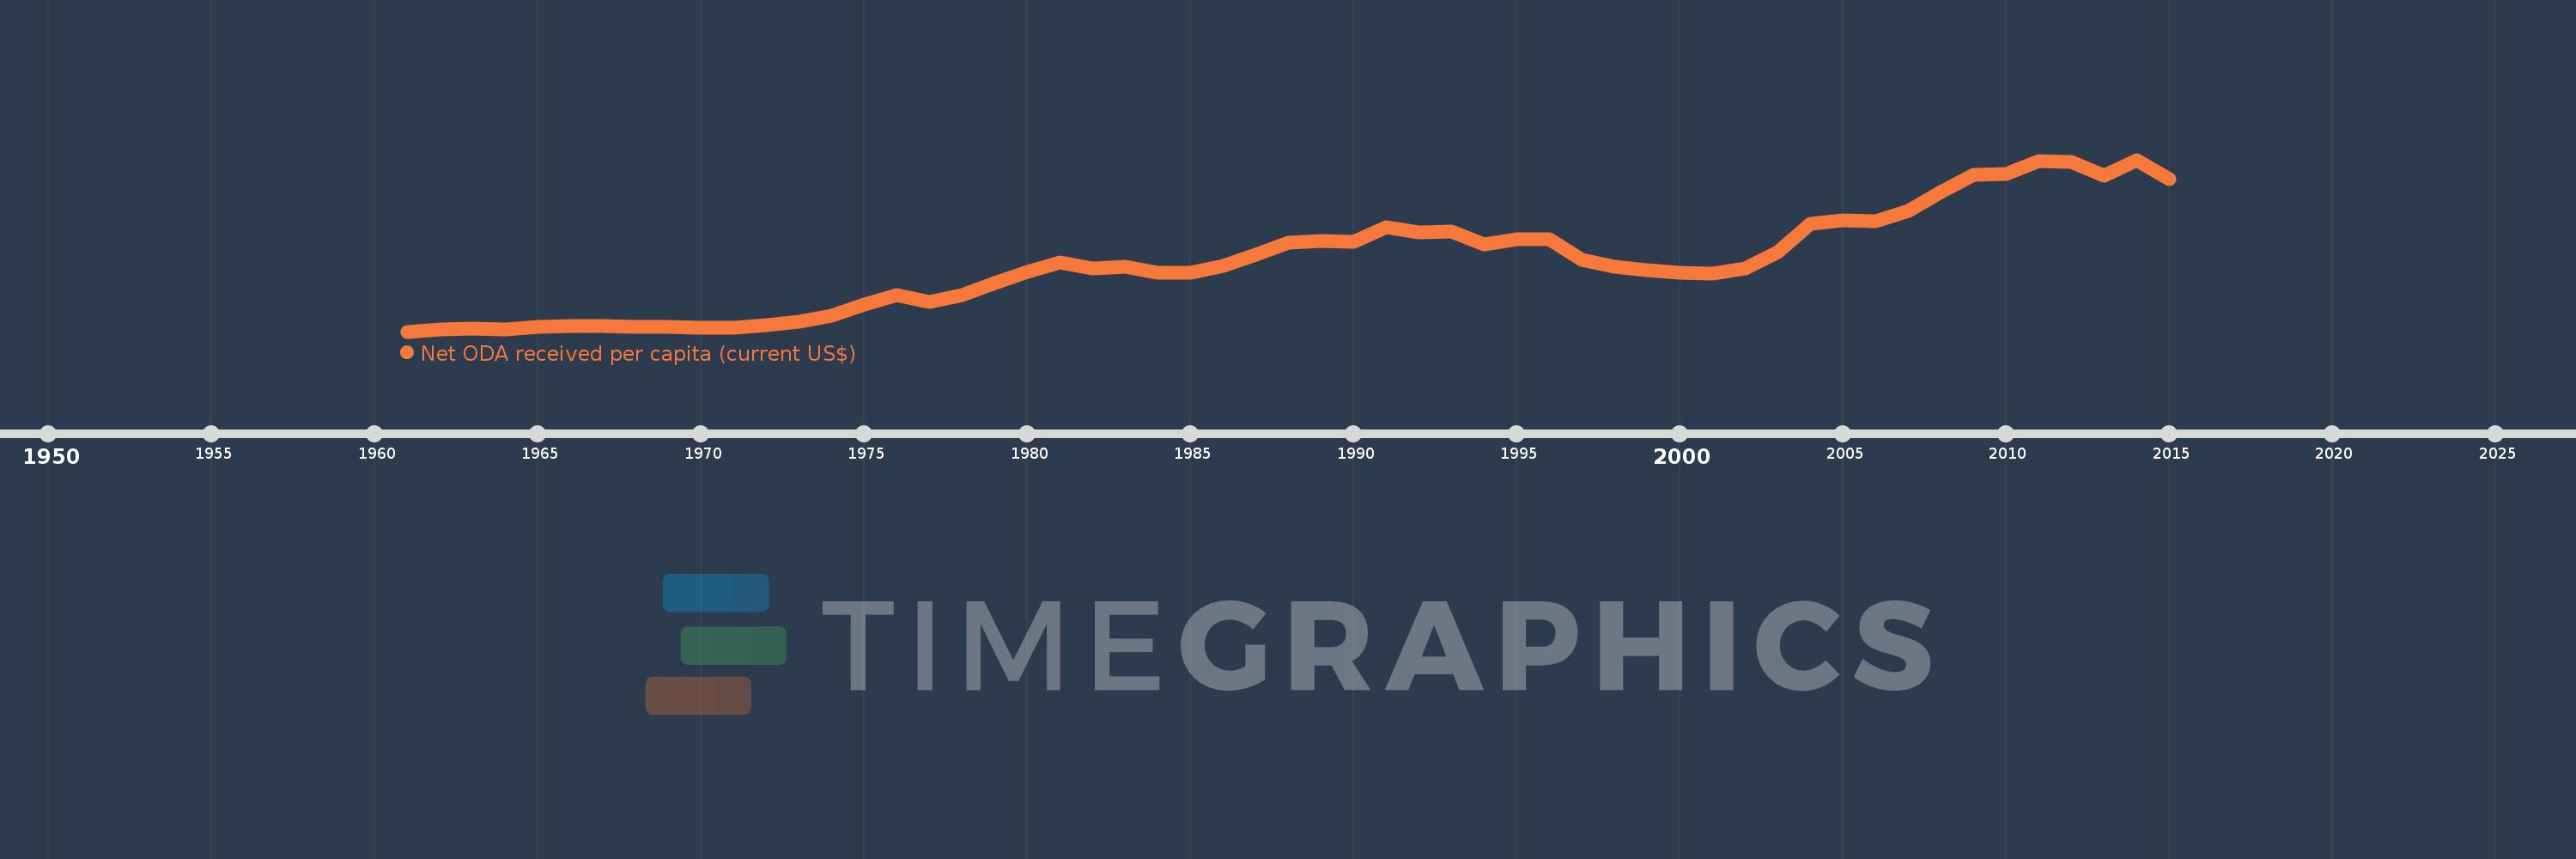
Least developed countries: UN classification
LDC
false
2
1
Net ODA received per capita (current US$)
2015,2014,2013,2012,2011,2010,2009,2008,2007,2006,2005,2004,2003,2002,2001,2000,1999,1998,1997,1996,1995,1994,1993,1992,1991,1990,1989,1988,1987,1986,1985,1984,1983,1982,1981,1980,1979,1978,1977,1976,1975,1974,1973,1972,1971,1970,1969,1968,1967,1966,1965,1964,1963,1962,1961
This statistics in other country:
AfghanistanAlbaniaAlgeriaAngolaAntigua and BarbudaArab WorldArgentinaArmeniaArubaAzerbaijanBahamas, TheBahrainBangladeshBarbadosBelarusBelizeBeninBermudaBhutanBoliviaBosnia and HerzegovinaBotswanaBrazilBritish Virgin IslandsBrunei DarussalamBurkina FasoBurundiCabo VerdeCambodiaCameroonCaribbean small statesCayman IslandsCentral African RepublicCentral Europe and the BalticsChadChileChinaColombiaComorosCongo, Dem. Rep.Congo, Rep.Costa RicaCote d'IvoireCroatiaCubaCyprusDjiboutiDominicaDominican RepublicEast Asia & PacificEast Asia & Pacific (excluding high income)East Asia & Pacific (IDA & IBRD countries)EcuadorEgypt, Arab Rep.El SalvadorEquatorial GuineaEritreaEthiopiaEuro areaEurope & Central AsiaEurope & Central Asia (excluding high income)Europe & Central Asia (IDA & IBRD countries)European UnionFijiFragile and conflict affected situationsFrench PolynesiaGabonGambia, TheGeorgiaGhanaGibraltarGrenadaGuatemalaGuineaGuinea-BissauGuyanaHaitiHeavily indebted poor countries (HIPC)High incomeHondurasHong Kong SAR, ChinaIBRD onlyIDA & IBRD totalIDA blendIDA onlyIDA totalIndiaIndonesiaIran, Islamic Rep.IraqIsraelJamaicaJordanKazakhstanKenyaKiribatiKorea, Dem. People’s Rep.Korea, Rep.KosovoKuwaitKyrgyz RepublicLao PDRLatin America & Caribbean Latin America & Caribbean (excluding high income)Latin America & the Caribbean (IDA & IBRD countries)Least developed countries: UN classificationLebanonLesothoLiberiaLibyaLow & middle incomeLow incomeLower middle incomeMacao SAR, ChinaMacedonia, FYRMadagascarMalawiMalaysiaMaldivesMaliMaltaMarshall IslandsMauritaniaMauritiusMexicoMicronesia, Fed. Sts.Middle East & North AfricaMiddle East & North Africa (excluding high income)Middle East & North Africa (IDA & IBRD countries)Middle incomeMoldovaMongoliaMontenegroMoroccoMozambiqueMyanmarNamibiaNauruNepalNew CaledoniaNicaraguaNigerNigeriaNorth AmericaNorthern Mariana IslandsOECD membersOmanOther small statesPacific island small statesPakistanPalauPanamaPapua New GuineaParaguayPeruPhilippinesQatarRwandaSamoaSao Tome and PrincipeSaudi ArabiaSenegalSerbiaSeychellesSierra LeoneSingaporeSloveniaSmall statesSolomon IslandsSomaliaSouth AfricaSouth AsiaSouth Asia (IDA & IBRD)South SudanSri LankaSt. Kitts and NevisSt. LuciaSt. Vincent and the GrenadinesSub-Saharan Africa Sub-Saharan Africa (excluding high income)Sub-Saharan Africa (IDA & IBRD countries)SudanSurinameSwazilandSyrian Arab RepublicTajikistanTanzaniaThailandTimor-LesteTogoTongaTrinidad and TobagoTunisiaTurkeyTurkmenistanTurks and Caicos IslandsTuvaluUgandaUkraineUnited Arab EmiratesUpper middle incomeUruguayUzbekistanVanuatuVenezuela, RBVietnamWest Bank and GazaWorldYemen, Rep.ZambiaZimbabwe Timeline:
This timeline shows a graph from 1961 to 2015 of Least developed countries: UN classification. No data until 1960. Number of actual observations by date: 55.
Source name:
World Development Indicators
Source organization:
Development Assistance Committee of the Organisation for Economic Co-operation and Development, Geographical Distribution of Financial Flows to Developing Countries, Development Co-operation Report, and International Development Statistics database. Data are available online at: www.oecd.org/dac/stats/idsonline. World Bank population estimates are used for the denominator.
Categories, topics:
Aid Effectiveness, Economy & Growth, External Debt
Last updated:
apr 23, 2017
Indicators value changes by year
Maximum:
52.708
jan 1, 2014
At the date of observation
Value
Absolute change
Change from previous value
jan 1, 1961
1.528
+1.528
0.0%
jan 1, 1962
2.047
+0.518
33.91%
jan 1, 1963
2.334
+0.288
14.05%
jan 1, 1964
2.261
-0.074
-3.16%
jan 1, 1965
2.934
+0.673
29.77%
jan 1, 1966
3.188
+0.255
8.69%
jan 1, 1967
3.242
+0.053
1.67%
jan 1, 1968
3.039
-0.203
-6.26%
jan 1, 1969
2.866
-0.173
-5.68%
jan 1, 1970
2.715
-0.151
-5.26%
jan 1, 1971
2.722
+0.007
0.26%
jan 1, 1972
3.344
+0.621
22.82%
jan 1, 1973
4.466
+1.122
33.56%
jan 1, 1974
6.142
+1.676
37.53%
jan 1, 1975
9.491
+3.35
54.54%
jan 1, 1976
12.351
+2.86
30.14%
jan 1, 1977
10.396
-1.956
-15.83%
jan 1, 1978
12.441
+2.045
19.67%
jan 1, 1979
16.023
+3.582
28.79%
jan 1, 1980
19.41
+3.387
21.14%
jan 1, 1981
22.074
+2.663
13.72%
jan 1, 1982
20.348
-1.725
-7.82%
jan 1, 1983
20.927
+0.579
2.84%
jan 1, 1984
19.045
-1.882
-8.99%
jan 1, 1985
19.166
+0.121
0.64%
jan 1, 1986
20.998
+1.832
9.56%
jan 1, 1987
24.525
+3.527
16.8%
jan 1, 1988
27.908
+3.383
13.79%
jan 1, 1989
28.606
+0.698
2.5%
jan 1, 1990
28.322
-0.284
-0.99%
jan 1, 1991
32.499
+4.177
14.75%
jan 1, 1992
31.149
-1.35
-4.15%
jan 1, 1993
31.338
+0.189
0.61%
jan 1, 1994
27.579
-3.759
-12.0%
jan 1, 1995
29.031
+1.451
5.26%
jan 1, 1996
28.941
-0.09
-0.31%
jan 1, 1997
22.989
-5.952
-20.57%
jan 1, 1998
20.88
-2.108
-9.17%
jan 1, 1999
19.898
-0.982
-4.7%
jan 1, 2000
19.027
-0.871
-4.38%
jan 1, 2001
18.742
-0.285
-1.5%
jan 1, 2002
20.46
+1.718
9.17%
jan 1, 2003
25.296
+4.836
23.64%
jan 1, 2004
33.709
+8.413
33.26%
jan 1, 2005
34.793
+1.084
3.21%
jan 1, 2006
34.42
-0.373
-1.07%
jan 1, 2007
37.411
+2.991
8.69%
jan 1, 2008
43.003
+5.592
14.95%
jan 1, 2009
48.333
+5.331
12.4%
jan 1, 2010
48.607
+0.274
0.57%
jan 1, 2011
52.248
+3.641
7.49%
jan 1, 2012
52.099
-0.149
-0.29%
jan 1, 2013
48.077
-4.021
-7.72%
jan 1, 2014
52.708
+4.631
9.63%
jan 1, 2015
46.918
-5.79
-10.99%
Ranking of countries by current statistics by years


Comments: