29
/
en
AIzaSyAYiBZKx7MnpbEhh9jyipgxe19OcubqV5w
April 1, 2024
270799
Turkmenistan
TKM
true
2
1
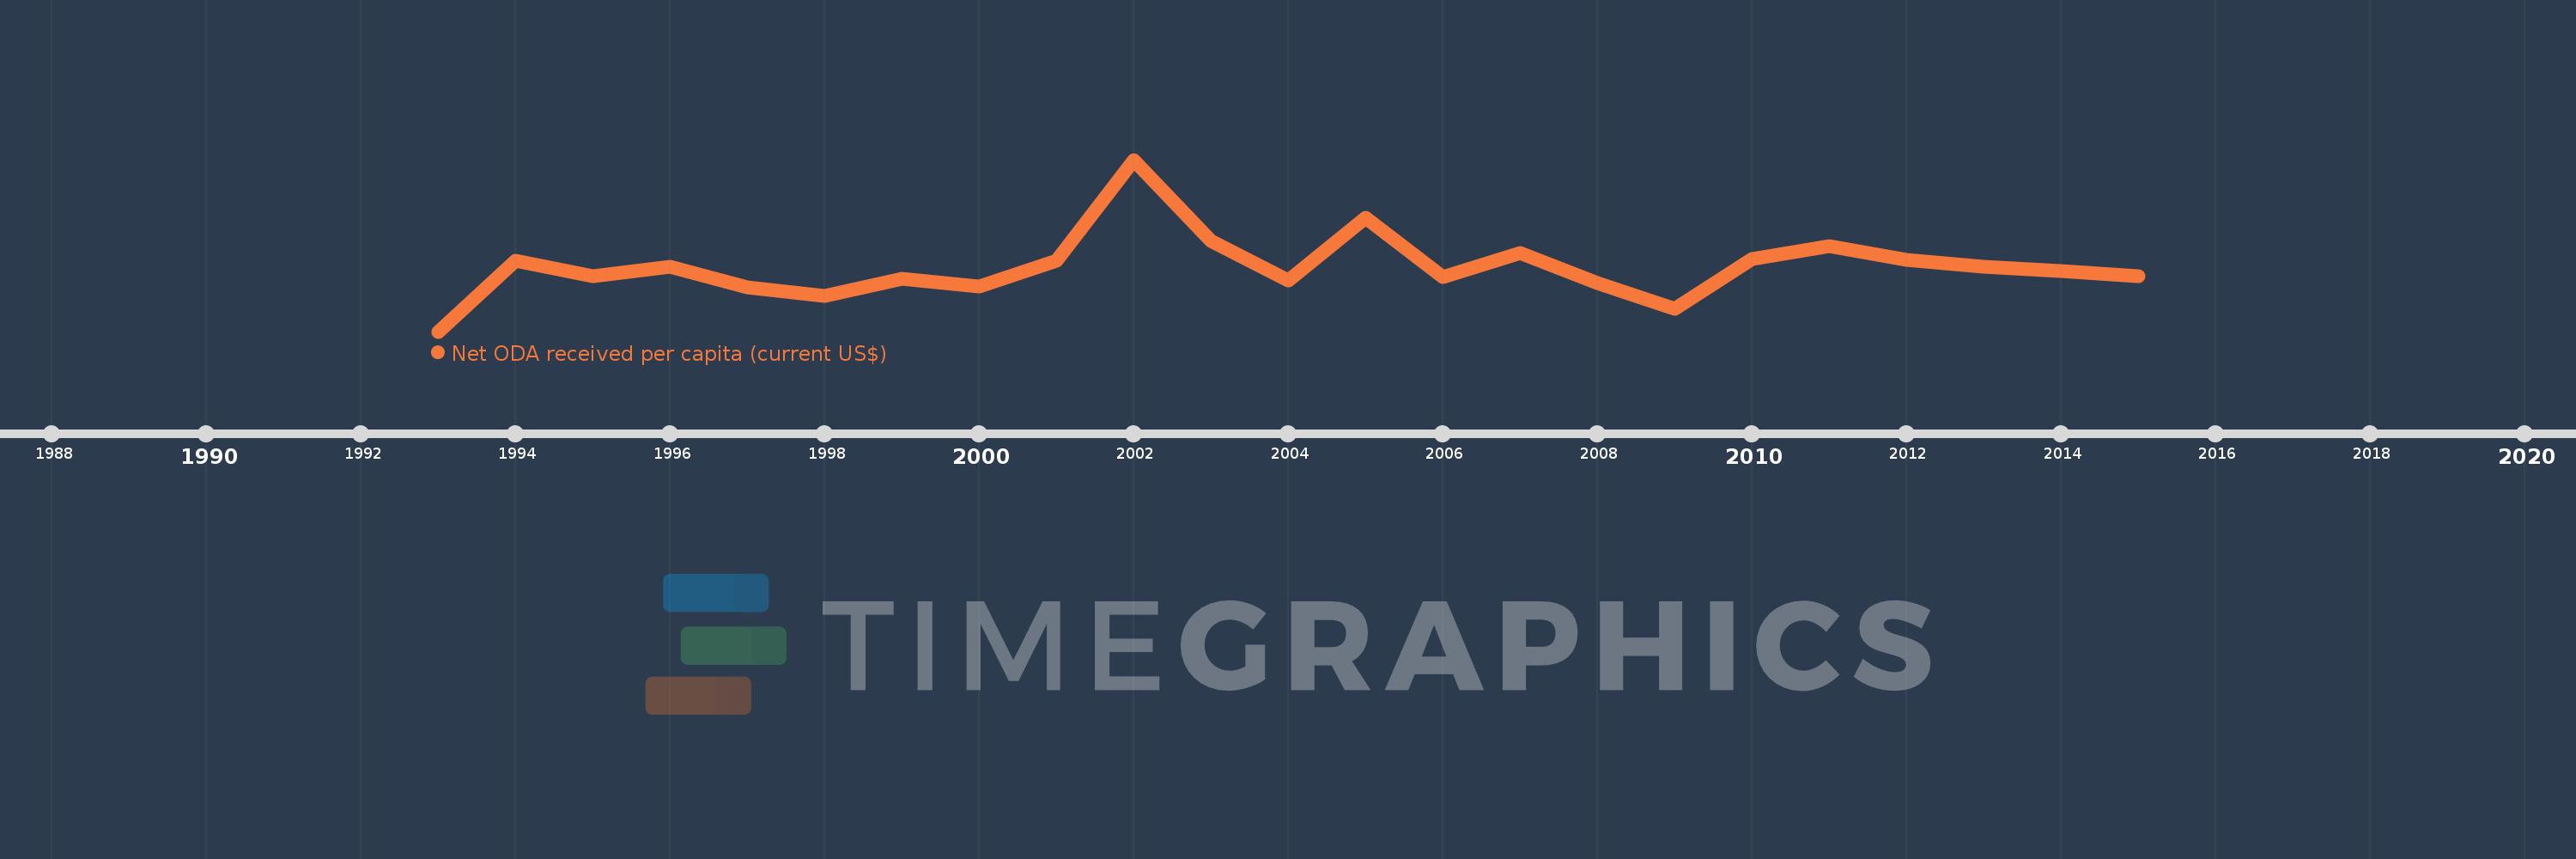
Net ODA received per capita (current US$)
2015,2014,2013,2012,2011,2010,2009,2008,2007,2006,2005,2004,2003,2002,2001,2000,1999,1998,1997,1996,1995,1994,1993
This statistics in other country:
AfghanistanAlbaniaAlgeriaAngolaAntigua and BarbudaArab WorldArgentinaArmeniaArubaAzerbaijanBahamas, TheBahrainBangladeshBarbadosBelarusBelizeBeninBermudaBhutanBoliviaBosnia and HerzegovinaBotswanaBrazilBritish Virgin IslandsBrunei DarussalamBurkina FasoBurundiCabo VerdeCambodiaCameroonCaribbean small statesCayman IslandsCentral African RepublicCentral Europe and the BalticsChadChileChinaColombiaComorosCongo, Dem. Rep.Congo, Rep.Costa RicaCote d'IvoireCroatiaCubaCyprusDjiboutiDominicaDominican RepublicEast Asia & PacificEast Asia & Pacific (excluding high income)East Asia & Pacific (IDA & IBRD countries)EcuadorEgypt, Arab Rep.El SalvadorEquatorial GuineaEritreaEthiopiaEuro areaEurope & Central AsiaEurope & Central Asia (excluding high income)Europe & Central Asia (IDA & IBRD countries)European UnionFijiFragile and conflict affected situationsFrench PolynesiaGabonGambia, TheGeorgiaGhanaGibraltarGrenadaGuatemalaGuineaGuinea-BissauGuyanaHaitiHeavily indebted poor countries (HIPC)High incomeHondurasHong Kong SAR, ChinaIBRD onlyIDA & IBRD totalIDA blendIDA onlyIDA totalIndiaIndonesiaIran, Islamic Rep.IraqIsraelJamaicaJordanKazakhstanKenyaKiribatiKorea, Dem. People’s Rep.Korea, Rep.KosovoKuwaitKyrgyz RepublicLao PDRLatin America & Caribbean Latin America & Caribbean (excluding high income)Latin America & the Caribbean (IDA & IBRD countries)Least developed countries: UN classificationLebanonLesothoLiberiaLibyaLow & middle incomeLow incomeLower middle incomeMacao SAR, ChinaMacedonia, FYRMadagascarMalawiMalaysiaMaldivesMaliMaltaMarshall IslandsMauritaniaMauritiusMexicoMicronesia, Fed. Sts.Middle East & North AfricaMiddle East & North Africa (excluding high income)Middle East & North Africa (IDA & IBRD countries)Middle incomeMoldovaMongoliaMontenegroMoroccoMozambiqueMyanmarNamibiaNauruNepalNew CaledoniaNicaraguaNigerNigeriaNorth AmericaNorthern Mariana IslandsOECD membersOmanOther small statesPacific island small statesPakistanPalauPanamaPapua New GuineaParaguayPeruPhilippinesQatarRwandaSamoaSao Tome and PrincipeSaudi ArabiaSenegalSerbiaSeychellesSierra LeoneSingaporeSloveniaSmall statesSolomon IslandsSomaliaSouth AfricaSouth AsiaSouth Asia (IDA & IBRD)South SudanSri LankaSt. Kitts and NevisSt. LuciaSt. Vincent and the GrenadinesSub-Saharan Africa Sub-Saharan Africa (excluding high income)Sub-Saharan Africa (IDA & IBRD countries)SudanSurinameSwazilandSyrian Arab RepublicTajikistanTanzaniaThailandTimor-LesteTogoTongaTrinidad and TobagoTunisiaTurkeyTurkmenistanTurks and Caicos IslandsTuvaluUgandaUkraineUnited Arab EmiratesUpper middle incomeUruguayUzbekistanVanuatuVenezuela, RBVietnamWest Bank and GazaWorldYemen, Rep.ZambiaZimbabwe Timeline:
This timeline shows a graph from 1993 to 2015 of Turkmenistan. No data until 1992. Number of actual observations by date: 23.
Source name:
World Development Indicators
Source organization:
Development Assistance Committee of the Organisation for Economic Co-operation and Development, Geographical Distribution of Financial Flows to Developing Countries, Development Co-operation Report, and International Development Statistics database. Data are available online at: www.oecd.org/dac/stats/idsonline. World Bank population estimates are used for the denominator.
Categories, topics:
Aid Effectiveness, Economy & Growth, External Debt
Last updated:
apr 23, 2017
Indicators value changes by year
Maximum:
16.534
jan 1, 2002
At the date of observation
Value
Absolute change
Change from previous value
jan 1, 1993
1.698
+1.698
0.0%
jan 1, 1994
7.788
+6.091
358.78%
jan 1, 1995
6.49
-1.298
-16.67%
jan 1, 1996
7.33
+0.84
12.95%
jan 1, 1997
5.539
-1.791
-24.43%
jan 1, 1998
4.774
-0.765
-13.82%
jan 1, 1999
6.236
+1.462
30.63%
jan 1, 2000
5.614
-0.622
-9.97%
jan 1, 2001
7.842
+2.228
39.68%
jan 1, 2002
16.534
+8.692
110.84%
jan 1, 2003
9.506
-7.028
-42.51%
jan 1, 2004
6.145
-3.362
-35.36%
jan 1, 2005
11.552
+5.408
88.01%
jan 1, 2006
6.397
-5.156
-44.63%
jan 1, 2007
8.478
+2.082
32.55%
jan 1, 2008
5.862
-2.616
-30.86%
jan 1, 2009
3.687
-2.175
-37.11%
jan 1, 2010
8.002
+4.315
117.04%
jan 1, 2011
9.078
+1.076
13.45%
jan 1, 2012
7.919
-1.159
-12.76%
jan 1, 2013
7.276
-0.643
-8.12%
jan 1, 2014
6.899
-0.378
-5.19%
jan 1, 2015
6.452
-0.447
-6.48%
Ranking of countries by current statistics by years


Comments: