29
/
en
AIzaSyAYiBZKx7MnpbEhh9jyipgxe19OcubqV5w
April 1, 2024
30141
Euro area
EMU
false
2
1
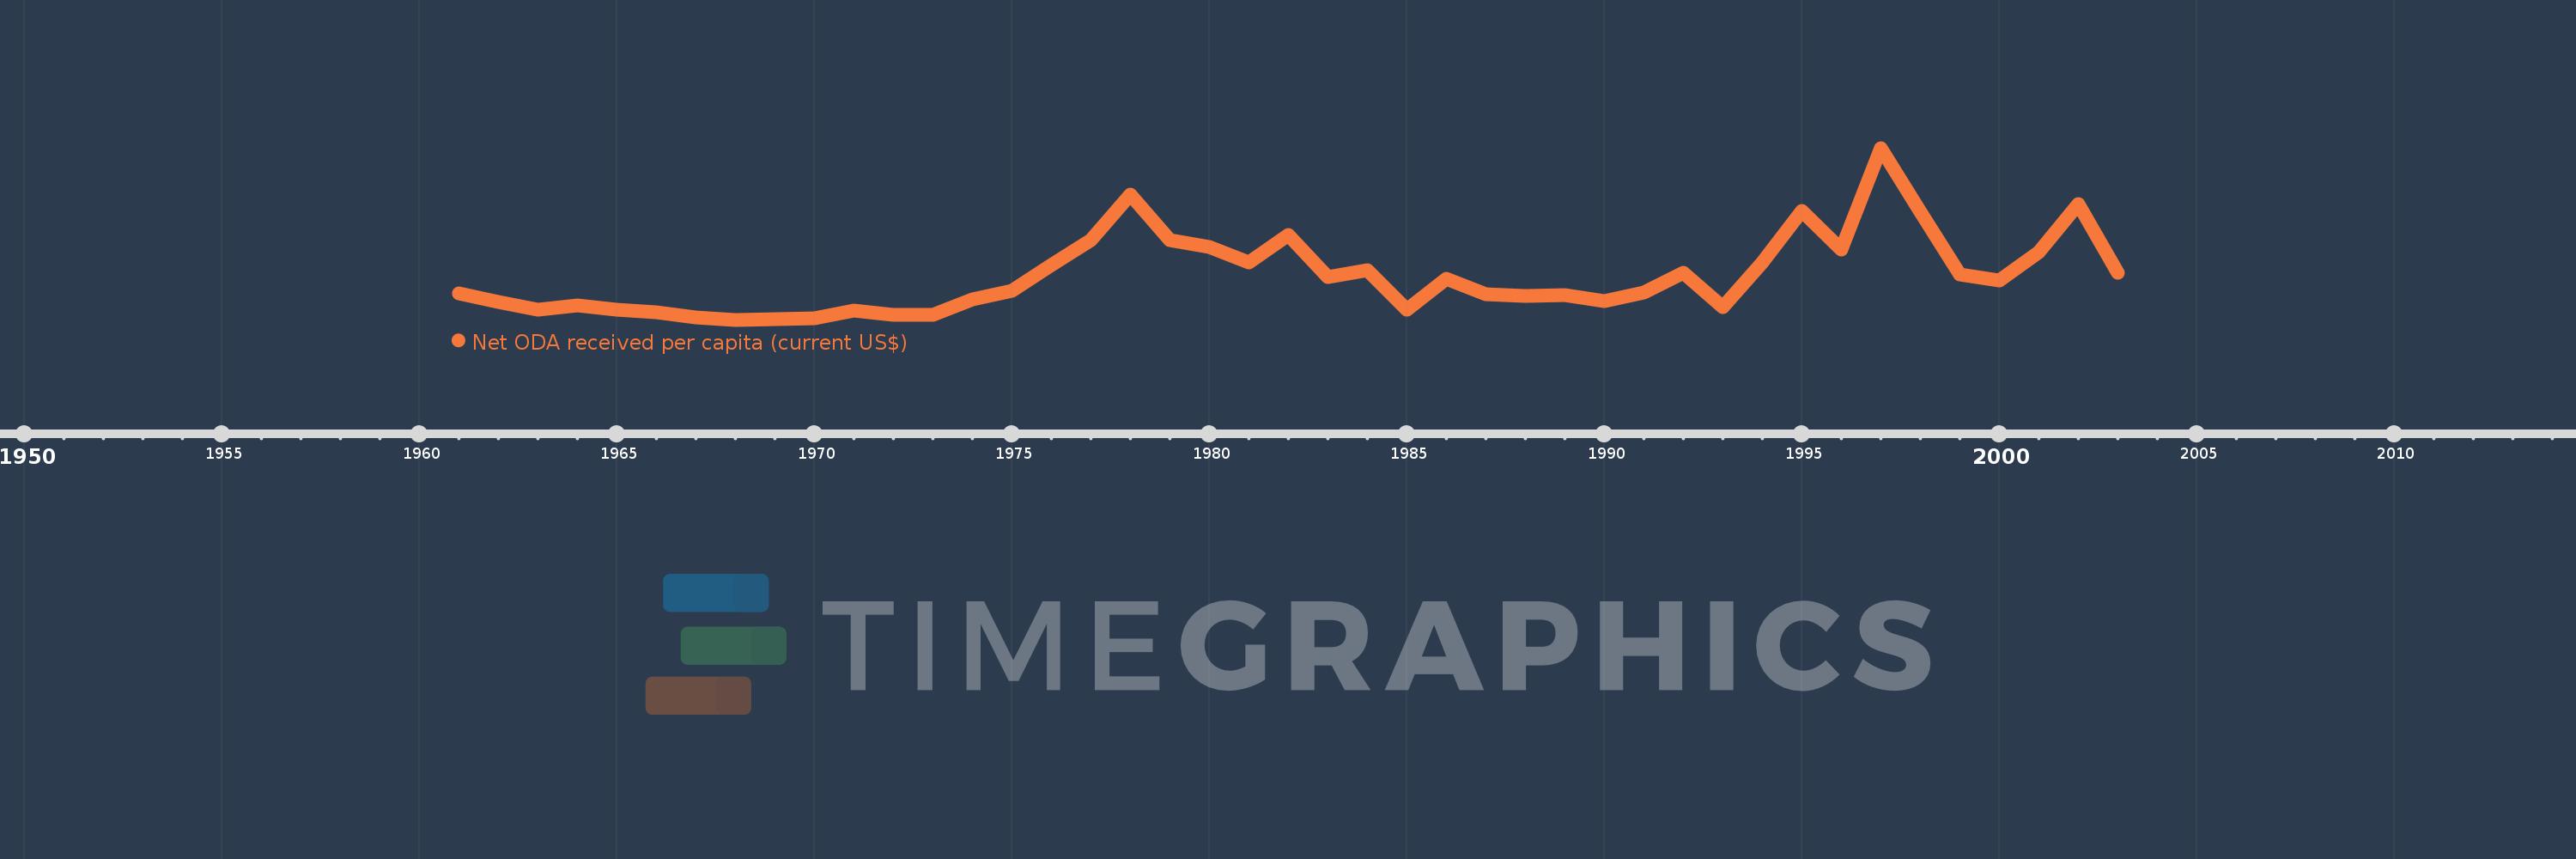
Net ODA received per capita (current US$)
2003,2002,2001,2000,1999,1998,1997,1996,1995,1994,1993,1992,1991,1990,1989,1988,1987,1986,1985,1984,1983,1982,1981,1980,1979,1978,1977,1976,1975,1974,1973,1972,1971,1970,1969,1968,1967,1966,1965,1964,1963,1962,1961
This statistics in other country:
AfghanistanAlbaniaAlgeriaAngolaAntigua and BarbudaArab WorldArgentinaArmeniaArubaAzerbaijanBahamas, TheBahrainBangladeshBarbadosBelarusBelizeBeninBermudaBhutanBoliviaBosnia and HerzegovinaBotswanaBrazilBritish Virgin IslandsBrunei DarussalamBurkina FasoBurundiCabo VerdeCambodiaCameroonCaribbean small statesCayman IslandsCentral African RepublicCentral Europe and the BalticsChadChileChinaColombiaComorosCongo, Dem. Rep.Congo, Rep.Costa RicaCote d'IvoireCroatiaCubaCyprusDjiboutiDominicaDominican RepublicEast Asia & PacificEast Asia & Pacific (excluding high income)East Asia & Pacific (IDA & IBRD countries)EcuadorEgypt, Arab Rep.El SalvadorEquatorial GuineaEritreaEthiopiaEuro areaEurope & Central AsiaEurope & Central Asia (excluding high income)Europe & Central Asia (IDA & IBRD countries)European UnionFijiFragile and conflict affected situationsFrench PolynesiaGabonGambia, TheGeorgiaGhanaGibraltarGrenadaGuatemalaGuineaGuinea-BissauGuyanaHaitiHeavily indebted poor countries (HIPC)High incomeHondurasHong Kong SAR, ChinaIBRD onlyIDA & IBRD totalIDA blendIDA onlyIDA totalIndiaIndonesiaIran, Islamic Rep.IraqIsraelJamaicaJordanKazakhstanKenyaKiribatiKorea, Dem. People’s Rep.Korea, Rep.KosovoKuwaitKyrgyz RepublicLao PDRLatin America & Caribbean Latin America & Caribbean (excluding high income)Latin America & the Caribbean (IDA & IBRD countries)Least developed countries: UN classificationLebanonLesothoLiberiaLibyaLow & middle incomeLow incomeLower middle incomeMacao SAR, ChinaMacedonia, FYRMadagascarMalawiMalaysiaMaldivesMaliMaltaMarshall IslandsMauritaniaMauritiusMexicoMicronesia, Fed. Sts.Middle East & North AfricaMiddle East & North Africa (excluding high income)Middle East & North Africa (IDA & IBRD countries)Middle incomeMoldovaMongoliaMontenegroMoroccoMozambiqueMyanmarNamibiaNauruNepalNew CaledoniaNicaraguaNigerNigeriaNorth AmericaNorthern Mariana IslandsOECD membersOmanOther small statesPacific island small statesPakistanPalauPanamaPapua New GuineaParaguayPeruPhilippinesQatarRwandaSamoaSao Tome and PrincipeSaudi ArabiaSenegalSerbiaSeychellesSierra LeoneSingaporeSloveniaSmall statesSolomon IslandsSomaliaSouth AfricaSouth AsiaSouth Asia (IDA & IBRD)South SudanSri LankaSt. Kitts and NevisSt. LuciaSt. Vincent and the GrenadinesSub-Saharan Africa Sub-Saharan Africa (excluding high income)Sub-Saharan Africa (IDA & IBRD countries)SudanSurinameSwazilandSyrian Arab RepublicTajikistanTanzaniaThailandTimor-LesteTogoTongaTrinidad and TobagoTunisiaTurkeyTurkmenistanTurks and Caicos IslandsTuvaluUgandaUkraineUnited Arab EmiratesUpper middle incomeUruguayUzbekistanVanuatuVenezuela, RBVietnamWest Bank and GazaWorldYemen, Rep.ZambiaZimbabwe Timeline:
This timeline shows a graph from 1961 to 2003 of Euro area. No data until 1960. Number of actual observations by date: 43.
Source name:
World Development Indicators
Source organization:
Development Assistance Committee of the Organisation for Economic Co-operation and Development, Geographical Distribution of Financial Flows to Developing Countries, Development Co-operation Report, and International Development Statistics database. Data are available online at: www.oecd.org/dac/stats/idsonline. World Bank population estimates are used for the denominator.
Categories, topics:
Aid Effectiveness, Economy & Growth, External Debt
Last updated:
apr 23, 2017
Indicators value changes by year
At the date of observation
Value
Absolute change
Change from previous value
jan 1, 1961
0.137
+0.137
0.0%
jan 1, 1962
0.112
-0.025
-18.37%
jan 1, 1963
0.091
-0.021
-19.12%
jan 1, 1964
0.104
+0.013
14.88%
jan 1, 1965
0.09
-0.014
-13.33%
jan 1, 1966
0.083
-0.007
-8.19%
jan 1, 1967
0.068
-0.015
-17.8%
jan 1, 1968
0.062
-0.006
-8.72%
jan 1, 1969
0.063
+0.001
0.93%
jan 1, 1970
0.066
+0.003
4.81%
jan 1, 1971
0.088
+0.023
34.55%
jan 1, 1972
0.076
-0.012
-13.85%
jan 1, 1973
0.077
+0.001
0.78%
jan 1, 1974
0.121
+0.045
58.21%
jan 1, 1975
0.145
+0.024
19.58%
jan 1, 1976
0.219
+0.074
50.68%
jan 1, 1977
0.291
+0.072
32.82%
jan 1, 1978
0.423
+0.132
45.34%
jan 1, 1979
0.291
-0.132
-31.24%
jan 1, 1980
0.271
-0.019
-6.6%
jan 1, 1981
0.227
-0.044
-16.37%
jan 1, 1982
0.307
+0.08
35.29%
jan 1, 1983
0.184
-0.123
-40.1%
jan 1, 1984
0.205
+0.021
11.65%
jan 1, 1985
0.092
-0.113
-54.98%
jan 1, 1986
0.18
+0.088
95.13%
jan 1, 1987
0.136
-0.044
-24.44%
jan 1, 1988
0.13
-0.007
-4.86%
jan 1, 1989
0.134
+0.004
3.38%
jan 1, 1990
0.115
-0.019
-14.52%
jan 1, 1991
0.14
+0.026
22.52%
jan 1, 1992
0.197
+0.056
40.22%
jan 1, 1993
0.098
-0.099
-50.19%
jan 1, 1994
0.228
+0.13
132.26%
jan 1, 1995
0.375
+0.147
64.43%
jan 1, 1996
0.263
-0.112
-29.9%
jan 1, 1997
0.557
+0.295
112.23%
jan 1, 1998
0.374
-0.183
-32.89%
jan 1, 1999
0.193
-0.181
-48.32%
jan 1, 2000
0.176
-0.018
-9.14%
jan 1, 2001
0.256
+0.08
45.57%
jan 1, 2002
0.395
+0.139
54.52%
jan 1, 2003
0.197
-0.198
-50.16%
Ranking of countries by current statistics by years


Comments: