29
/
en
AIzaSyAYiBZKx7MnpbEhh9jyipgxe19OcubqV5w
April 1, 2024
219935
Papua New Guinea
PNG
true
2
1
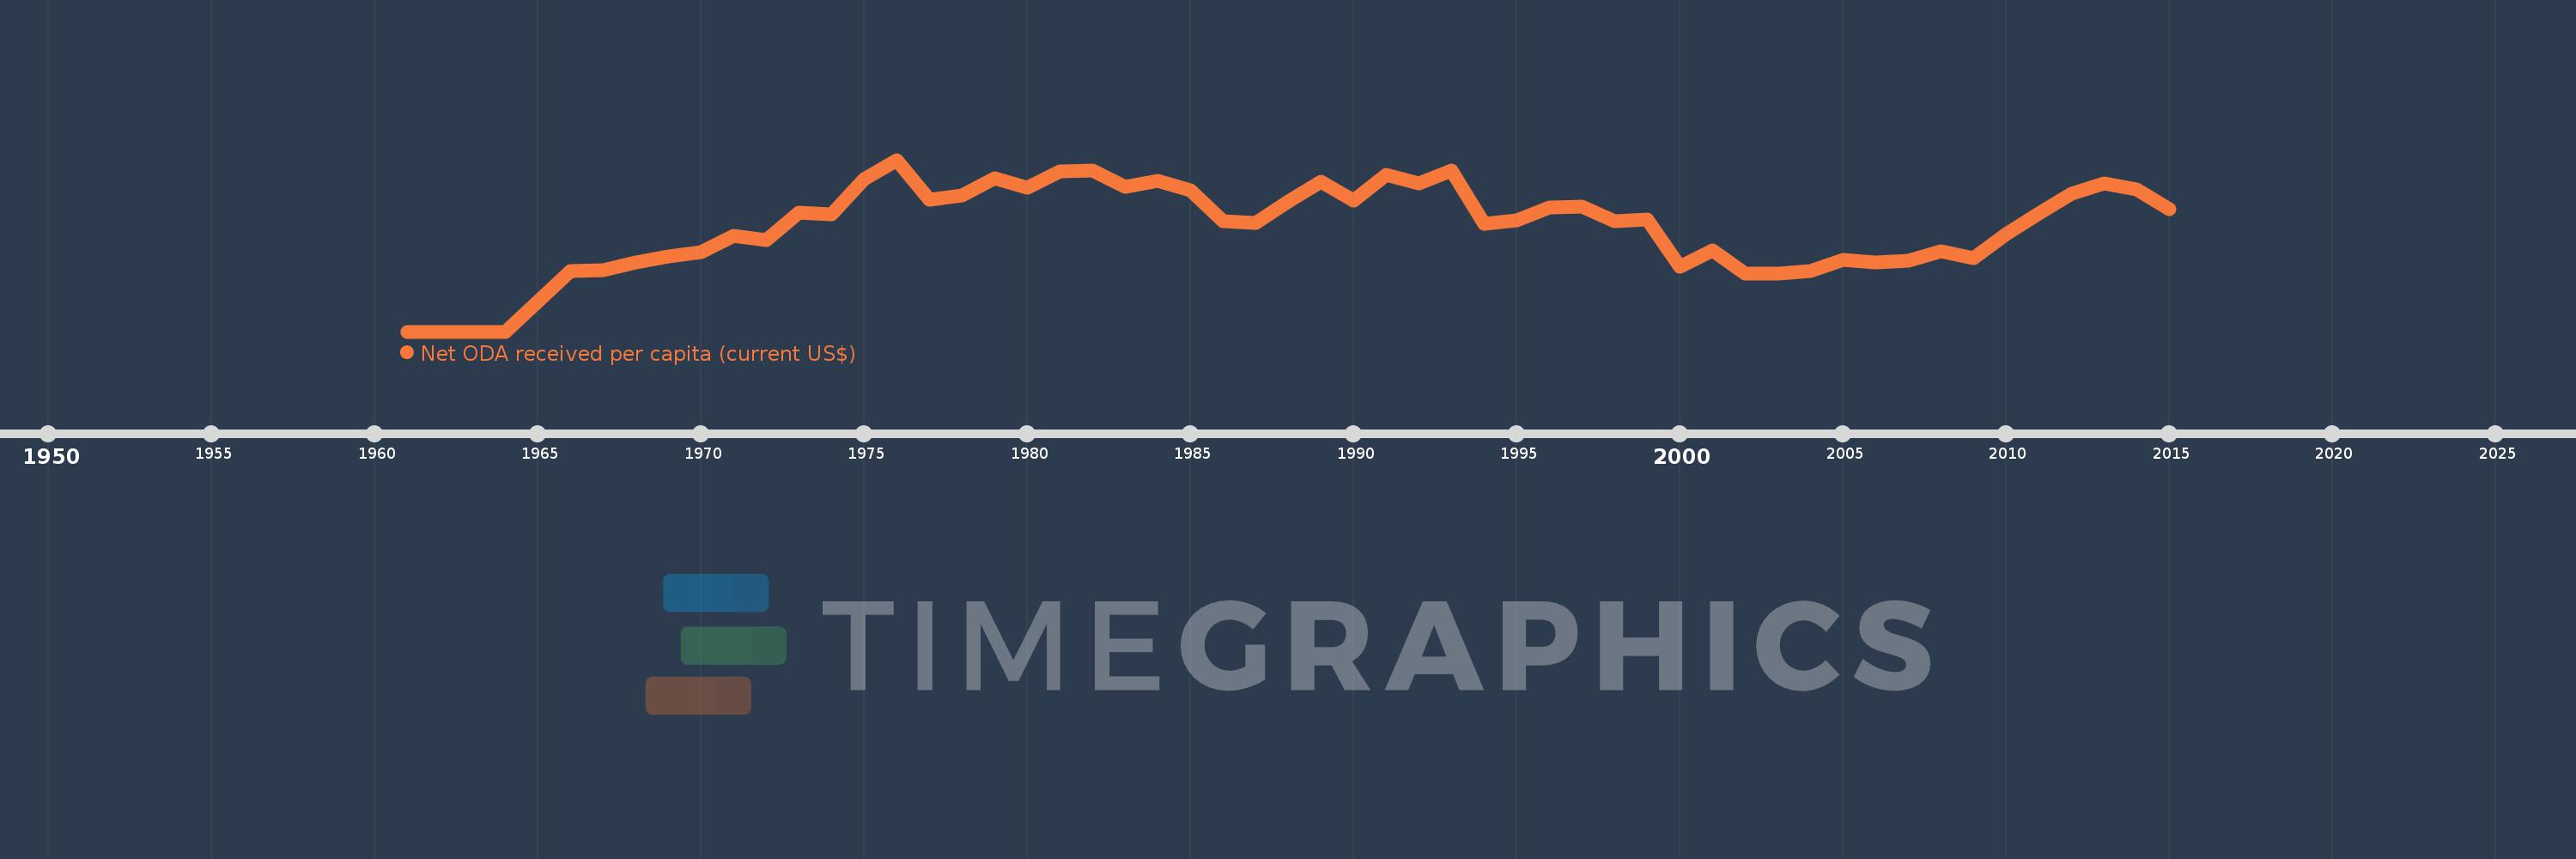
Net ODA received per capita (current US$)
2015,2014,2013,2012,2011,2010,2009,2008,2007,2006,2005,2004,2003,2002,2001,2000,1999,1998,1997,1996,1995,1994,1993,1992,1991,1990,1989,1988,1987,1986,1985,1984,1983,1982,1981,1980,1979,1978,1977,1976,1975,1974,1973,1972,1971,1970,1969,1968,1967,1966,1964,1962,1961
This statistics in other country:
AfghanistanAlbaniaAlgeriaAngolaAntigua and BarbudaArab WorldArgentinaArmeniaArubaAzerbaijanBahamas, TheBahrainBangladeshBarbadosBelarusBelizeBeninBermudaBhutanBoliviaBosnia and HerzegovinaBotswanaBrazilBritish Virgin IslandsBrunei DarussalamBurkina FasoBurundiCabo VerdeCambodiaCameroonCaribbean small statesCayman IslandsCentral African RepublicCentral Europe and the BalticsChadChileChinaColombiaComorosCongo, Dem. Rep.Congo, Rep.Costa RicaCote d'IvoireCroatiaCubaCyprusDjiboutiDominicaDominican RepublicEast Asia & PacificEast Asia & Pacific (excluding high income)East Asia & Pacific (IDA & IBRD countries)EcuadorEgypt, Arab Rep.El SalvadorEquatorial GuineaEritreaEthiopiaEuro areaEurope & Central AsiaEurope & Central Asia (excluding high income)Europe & Central Asia (IDA & IBRD countries)European UnionFijiFragile and conflict affected situationsFrench PolynesiaGabonGambia, TheGeorgiaGhanaGibraltarGrenadaGuatemalaGuineaGuinea-BissauGuyanaHaitiHeavily indebted poor countries (HIPC)High incomeHondurasHong Kong SAR, ChinaIBRD onlyIDA & IBRD totalIDA blendIDA onlyIDA totalIndiaIndonesiaIran, Islamic Rep.IraqIsraelJamaicaJordanKazakhstanKenyaKiribatiKorea, Dem. People’s Rep.Korea, Rep.KosovoKuwaitKyrgyz RepublicLao PDRLatin America & Caribbean Latin America & Caribbean (excluding high income)Latin America & the Caribbean (IDA & IBRD countries)Least developed countries: UN classificationLebanonLesothoLiberiaLibyaLow & middle incomeLow incomeLower middle incomeMacao SAR, ChinaMacedonia, FYRMadagascarMalawiMalaysiaMaldivesMaliMaltaMarshall IslandsMauritaniaMauritiusMexicoMicronesia, Fed. Sts.Middle East & North AfricaMiddle East & North Africa (excluding high income)Middle East & North Africa (IDA & IBRD countries)Middle incomeMoldovaMongoliaMontenegroMoroccoMozambiqueMyanmarNamibiaNauruNepalNew CaledoniaNicaraguaNigerNigeriaNorth AmericaNorthern Mariana IslandsOECD membersOmanOther small statesPacific island small statesPakistanPalauPanamaPapua New GuineaParaguayPeruPhilippinesQatarRwandaSamoaSao Tome and PrincipeSaudi ArabiaSenegalSerbiaSeychellesSierra LeoneSingaporeSloveniaSmall statesSolomon IslandsSomaliaSouth AfricaSouth AsiaSouth Asia (IDA & IBRD)South SudanSri LankaSt. Kitts and NevisSt. LuciaSt. Vincent and the GrenadinesSub-Saharan Africa Sub-Saharan Africa (excluding high income)Sub-Saharan Africa (IDA & IBRD countries)SudanSurinameSwazilandSyrian Arab RepublicTajikistanTanzaniaThailandTimor-LesteTogoTongaTrinidad and TobagoTunisiaTurkeyTurkmenistanTurks and Caicos IslandsTuvaluUgandaUkraineUnited Arab EmiratesUpper middle incomeUruguayUzbekistanVanuatuVenezuela, RBVietnamWest Bank and GazaWorldYemen, Rep.ZambiaZimbabwe Timeline:
This timeline shows a graph from 1961 to 2015 of Papua New Guinea. No data until 1960. Number of actual observations by date: 53.
Source name:
World Development Indicators
Source organization:
Development Assistance Committee of the Organisation for Economic Co-operation and Development, Geographical Distribution of Financial Flows to Developing Countries, Development Co-operation Report, and International Development Statistics database. Data are available online at: www.oecd.org/dac/stats/idsonline. World Bank population estimates are used for the denominator.
Categories, topics:
Aid Effectiveness, Economy & Growth, External Debt
Last updated:
apr 23, 2017
Indicators value changes by year
Maximum:
108.556
jan 1, 1976
At the date of observation
Value
Absolute change
Change from previous value
jan 1, 1961
0.005
+0.005
0.0%
jan 1, 1962
0.005
0.0
-1.7%
jan 1, 1964
0.005
0.0
-3.59%
jan 1, 1966
38.203
+38.198
792.85K%
jan 1, 1967
38.756
+0.553
1.45%
jan 1, 1968
43.499
+4.743
12.24%
jan 1, 1969
47.652
+4.153
9.55%
jan 1, 1970
50.133
+2.48
5.21%
jan 1, 1971
60.647
+10.514
20.97%
jan 1, 1972
57.753
-2.894
-4.77%
jan 1, 1973
75.292
+17.539
30.37%
jan 1, 1974
74.015
-1.278
-1.7%
jan 1, 1975
96.369
+22.354
30.2%
jan 1, 1976
108.556
+12.187
12.65%
jan 1, 1977
83.143
-25.413
-23.41%
jan 1, 1978
85.89
+2.747
3.3%
jan 1, 1979
97.009
+11.118
12.94%
jan 1, 1980
90.706
-6.303
-6.5%
jan 1, 1981
101.238
+10.533
11.61%
jan 1, 1982
101.508
+0.269
0.27%
jan 1, 1983
91.386
-10.121
-9.97%
jan 1, 1984
95.294
+3.908
4.28%
jan 1, 1985
89.262
-6.032
-6.33%
jan 1, 1986
69.902
-19.36
-21.69%
jan 1, 1987
68.618
-1.284
-1.84%
jan 1, 1988
82.142
+13.523
19.71%
jan 1, 1989
94.464
+12.322
15.0%
jan 1, 1990
83.001
-11.463
-12.13%
jan 1, 1991
99.185
+16.183
19.5%
jan 1, 1992
93.476
-5.708
-5.76%
jan 1, 1993
101.883
+8.407
8.99%
jan 1, 1994
68.295
-33.588
-32.97%
jan 1, 1995
70.263
+1.968
2.88%
jan 1, 1996
78.513
+8.249
11.74%
jan 1, 1997
78.776
+0.263
0.34%
jan 1, 1998
69.701
-9.075
-11.52%
jan 1, 1999
70.862
+1.161
1.67%
jan 1, 2000
41.24
-29.621
-41.8%
jan 1, 2001
51.2
+9.959
24.15%
jan 1, 2002
36.796
-14.404
-28.13%
jan 1, 2003
36.416
-0.38
-1.03%
jan 1, 2004
37.998
+1.582
4.34%
jan 1, 2005
45.175
+7.177
18.89%
jan 1, 2006
43.85
-1.325
-2.93%
jan 1, 2007
44.721
+0.872
1.99%
jan 1, 2008
50.795
+6.073
13.58%
jan 1, 2009
46.197
-4.598
-9.05%
jan 1, 2010
61.505
+15.308
33.14%
jan 1, 2011
74.684
+13.179
21.43%
jan 1, 2012
87.32
+12.636
16.92%
jan 1, 2013
93.475
+6.155
7.05%
jan 1, 2014
89.828
-3.647
-3.9%
jan 1, 2015
77.353
-12.475
-13.89%
Ranking of countries by current statistics by years


Comments: