29
/
en
AIzaSyAYiBZKx7MnpbEhh9jyipgxe19OcubqV5w
April 1, 2024
105245
Chile
CHL
true
2
1
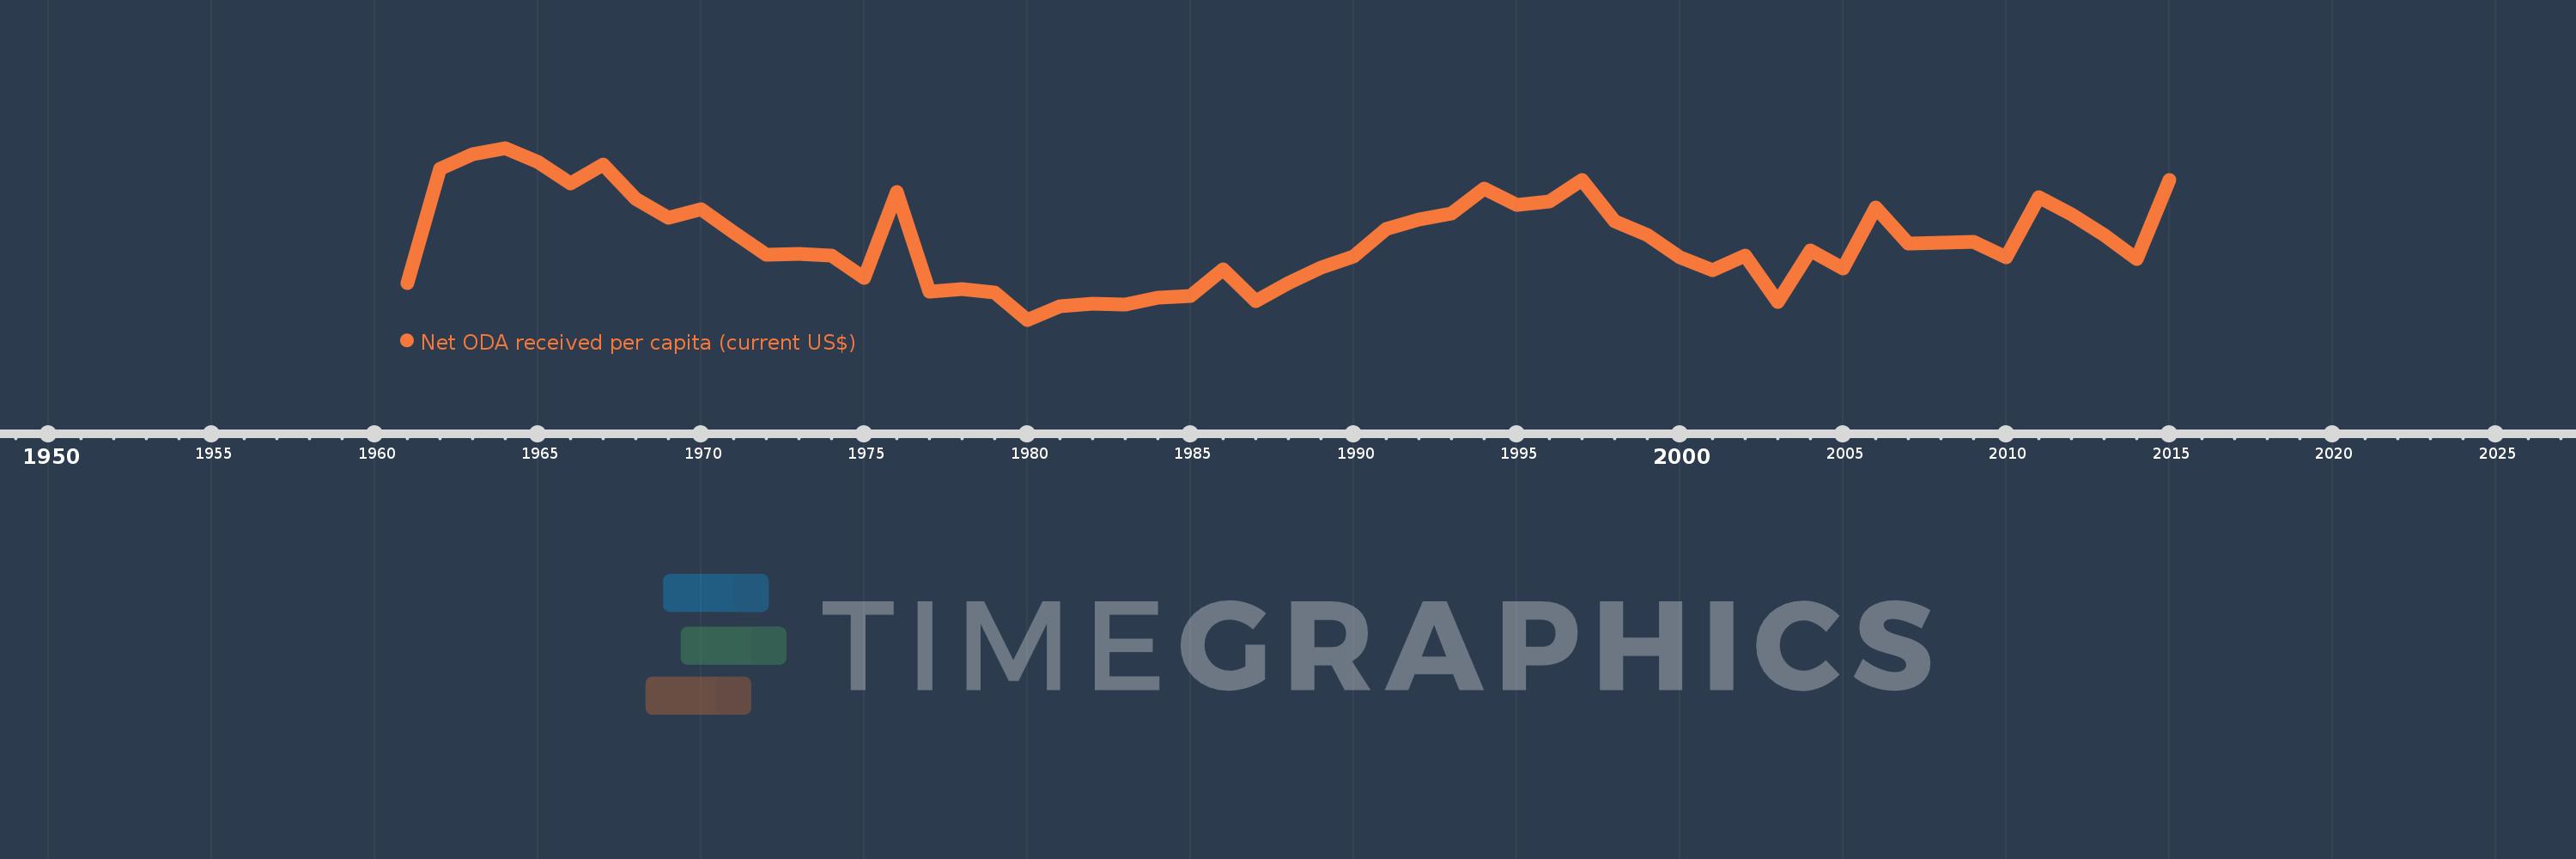
Net ODA received per capita (current US$)
2015,2014,2013,2012,2011,2010,2009,2008,2007,2006,2005,2004,2003,2002,2001,2000,1999,1998,1997,1996,1995,1994,1993,1992,1991,1990,1989,1988,1987,1986,1985,1984,1983,1982,1981,1980,1979,1978,1977,1976,1975,1974,1973,1972,1971,1970,1969,1968,1967,1966,1965,1964,1963,1962,1961
This statistics in other country:
AfghanistanAlbaniaAlgeriaAngolaAntigua and BarbudaArab WorldArgentinaArmeniaArubaAzerbaijanBahamas, TheBahrainBangladeshBarbadosBelarusBelizeBeninBermudaBhutanBoliviaBosnia and HerzegovinaBotswanaBrazilBritish Virgin IslandsBrunei DarussalamBurkina FasoBurundiCabo VerdeCambodiaCameroonCaribbean small statesCayman IslandsCentral African RepublicCentral Europe and the BalticsChadChileChinaColombiaComorosCongo, Dem. Rep.Congo, Rep.Costa RicaCote d'IvoireCroatiaCubaCyprusDjiboutiDominicaDominican RepublicEast Asia & PacificEast Asia & Pacific (excluding high income)East Asia & Pacific (IDA & IBRD countries)EcuadorEgypt, Arab Rep.El SalvadorEquatorial GuineaEritreaEthiopiaEuro areaEurope & Central AsiaEurope & Central Asia (excluding high income)Europe & Central Asia (IDA & IBRD countries)European UnionFijiFragile and conflict affected situationsFrench PolynesiaGabonGambia, TheGeorgiaGhanaGibraltarGrenadaGuatemalaGuineaGuinea-BissauGuyanaHaitiHeavily indebted poor countries (HIPC)High incomeHondurasHong Kong SAR, ChinaIBRD onlyIDA & IBRD totalIDA blendIDA onlyIDA totalIndiaIndonesiaIran, Islamic Rep.IraqIsraelJamaicaJordanKazakhstanKenyaKiribatiKorea, Dem. People’s Rep.Korea, Rep.KosovoKuwaitKyrgyz RepublicLao PDRLatin America & Caribbean Latin America & Caribbean (excluding high income)Latin America & the Caribbean (IDA & IBRD countries)Least developed countries: UN classificationLebanonLesothoLiberiaLibyaLow & middle incomeLow incomeLower middle incomeMacao SAR, ChinaMacedonia, FYRMadagascarMalawiMalaysiaMaldivesMaliMaltaMarshall IslandsMauritaniaMauritiusMexicoMicronesia, Fed. Sts.Middle East & North AfricaMiddle East & North Africa (excluding high income)Middle East & North Africa (IDA & IBRD countries)Middle incomeMoldovaMongoliaMontenegroMoroccoMozambiqueMyanmarNamibiaNauruNepalNew CaledoniaNicaraguaNigerNigeriaNorth AmericaNorthern Mariana IslandsOECD membersOmanOther small statesPacific island small statesPakistanPalauPanamaPapua New GuineaParaguayPeruPhilippinesQatarRwandaSamoaSao Tome and PrincipeSaudi ArabiaSenegalSerbiaSeychellesSierra LeoneSingaporeSloveniaSmall statesSolomon IslandsSomaliaSouth AfricaSouth AsiaSouth Asia (IDA & IBRD)South SudanSri LankaSt. Kitts and NevisSt. LuciaSt. Vincent and the GrenadinesSub-Saharan Africa Sub-Saharan Africa (excluding high income)Sub-Saharan Africa (IDA & IBRD countries)SudanSurinameSwazilandSyrian Arab RepublicTajikistanTanzaniaThailandTimor-LesteTogoTongaTrinidad and TobagoTunisiaTurkeyTurkmenistanTurks and Caicos IslandsTuvaluUgandaUkraineUnited Arab EmiratesUpper middle incomeUruguayUzbekistanVanuatuVenezuela, RBVietnamWest Bank and GazaWorldYemen, Rep.ZambiaZimbabwe Timeline:
This timeline shows a graph from 1961 to 2015 of Chile. No data until 1960. Number of actual observations by date: 55.
Source name:
World Development Indicators
Source organization:
Development Assistance Committee of the Organisation for Economic Co-operation and Development, Geographical Distribution of Financial Flows to Developing Countries, Development Co-operation Report, and International Development Statistics database. Data are available online at: www.oecd.org/dac/stats/idsonline. World Bank population estimates are used for the denominator.
Categories, topics:
Aid Effectiveness, Economy & Growth, External Debt
Last updated:
apr 23, 2017
Indicators value changes by year
Minimum:
-2.519
jan 1, 1980
Maximum:
17.225
jan 1, 1964
At the date of observation
Value
Absolute change
Change from previous value
jan 1, 1961
1.691
+1.691
0.0%
jan 1, 1962
14.865
+13.174
779.3%
jan 1, 1963
16.498
+1.633
10.99%
jan 1, 1964
17.225
+0.726
4.4%
jan 1, 1965
15.665
-1.559
-9.05%
jan 1, 1966
13.104
-2.562
-16.35%
jan 1, 1967
15.345
+2.241
17.1%
jan 1, 1968
11.372
-3.972
-25.89%
jan 1, 1969
9.236
-2.136
-18.78%
jan 1, 1970
10.147
+0.911
9.86%
jan 1, 1971
7.568
-2.58
-25.42%
jan 1, 1972
4.917
-2.65
-35.02%
jan 1, 1973
5.012
+0.095
1.93%
jan 1, 1974
4.831
-0.181
-3.61%
jan 1, 1975
2.301
-2.529
-52.36%
jan 1, 1976
12.179
+9.877
429.21%
jan 1, 1977
0.69
-11.489
-94.34%
jan 1, 1978
0.986
+0.297
43.02%
jan 1, 1979
0.656
-0.33
-33.45%
jan 1, 1980
-2.519
-3.176
-483.81%
jan 1, 1981
-0.939
+1.58
-62.73%
jan 1, 1982
-0.636
+0.303
-32.28%
jan 1, 1983
-0.764
-0.128
20.15%
jan 1, 1984
0.009
+0.773
-101.11%
jan 1, 1985
0.189
+0.18
2.12K%
jan 1, 1986
3.304
+3.116
1.65K%
jan 1, 1987
-0.419
-3.723
-112.67%
jan 1, 1988
1.704
+2.122
-507.06%
jan 1, 1989
3.486
+1.782
104.61%
jan 1, 1990
4.772
+1.286
36.88%
jan 1, 1991
7.879
+3.107
65.12%
jan 1, 1992
9.05
+1.171
14.87%
jan 1, 1993
9.677
+0.627
6.93%
jan 1, 1994
12.601
+2.924
30.22%
jan 1, 1995
10.729
-1.872
-14.86%
jan 1, 1996
11.029
+0.3
2.8%
jan 1, 1997
13.57
+2.541
23.04%
jan 1, 1998
8.834
-4.737
-34.9%
jan 1, 1999
7.19
-1.644
-18.61%
jan 1, 2000
4.666
-2.524
-35.1%
jan 1, 2001
3.222
-1.444
-30.95%
jan 1, 2002
4.901
+1.679
52.1%
jan 1, 2003
-0.472
-5.373
-109.63%
jan 1, 2004
5.448
+5.92
-1.25K%
jan 1, 2005
3.417
-2.031
-37.28%
jan 1, 2006
10.396
+6.979
204.27%
jan 1, 2007
6.228
-4.168
-40.09%
jan 1, 2008
6.372
+0.144
2.31%
jan 1, 2009
6.479
+0.107
1.68%
jan 1, 2010
4.677
-1.802
-27.81%
jan 1, 2011
11.6
+6.923
148.01%
jan 1, 2012
9.551
-2.049
-17.67%
jan 1, 2013
7.188
-2.363
-24.75%
jan 1, 2014
4.503
-2.685
-37.35%
jan 1, 2015
13.543
+9.04
200.77%
Ranking of countries by current statistics by years


Comments: