29
/
en
AIzaSyAYiBZKx7MnpbEhh9jyipgxe19OcubqV5w
April 1, 2024
103967
Chad
TCD
true
2
1
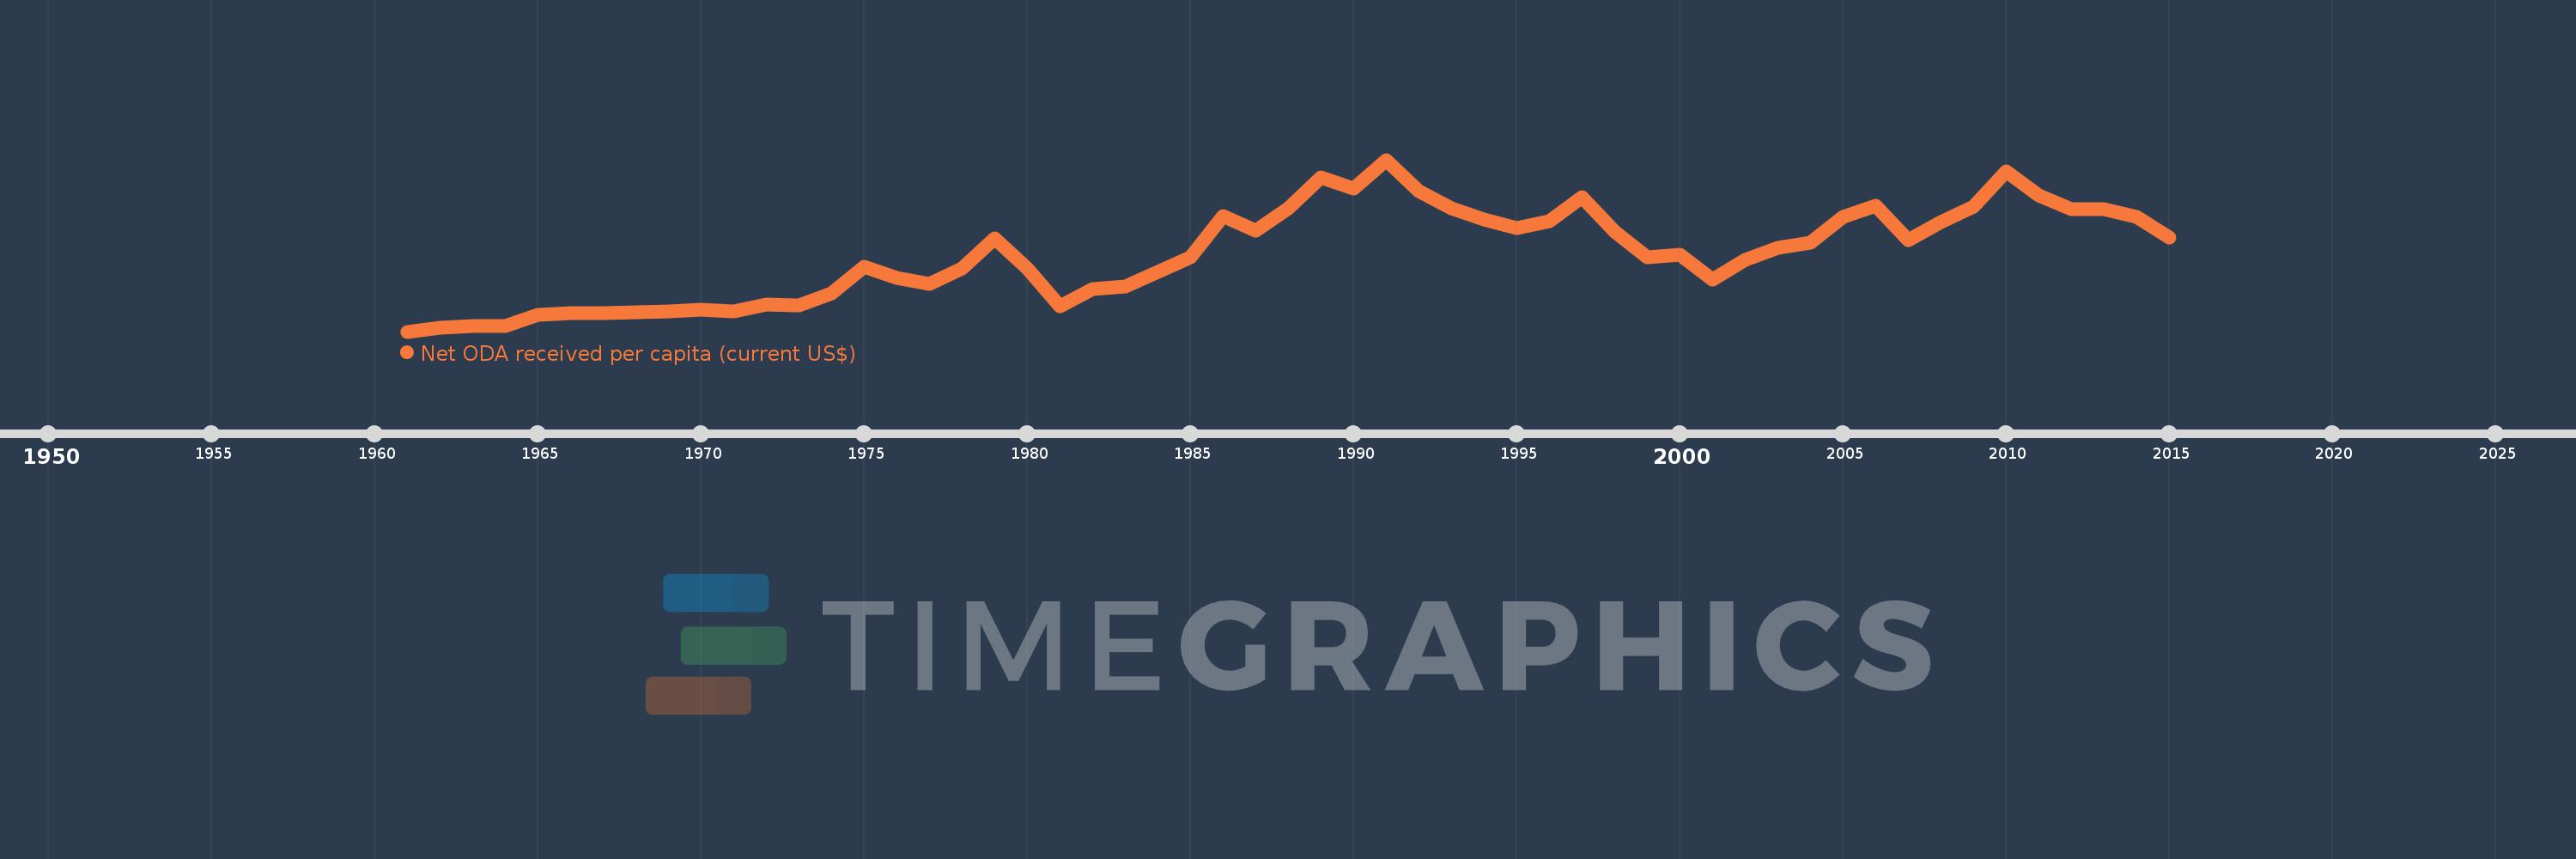
Net ODA received per capita (current US$)
2015,2014,2013,2012,2011,2010,2009,2008,2007,2006,2005,2004,2003,2002,2001,2000,1999,1998,1997,1996,1995,1994,1993,1992,1991,1990,1989,1988,1987,1986,1985,1984,1983,1982,1981,1980,1979,1978,1977,1976,1975,1974,1973,1972,1971,1970,1969,1968,1967,1966,1965,1964,1963,1962,1961
This statistics in other country:
AfghanistanAlbaniaAlgeriaAngolaAntigua and BarbudaArab WorldArgentinaArmeniaArubaAzerbaijanBahamas, TheBahrainBangladeshBarbadosBelarusBelizeBeninBermudaBhutanBoliviaBosnia and HerzegovinaBotswanaBrazilBritish Virgin IslandsBrunei DarussalamBurkina FasoBurundiCabo VerdeCambodiaCameroonCaribbean small statesCayman IslandsCentral African RepublicCentral Europe and the BalticsChadChileChinaColombiaComorosCongo, Dem. Rep.Congo, Rep.Costa RicaCote d'IvoireCroatiaCubaCyprusDjiboutiDominicaDominican RepublicEast Asia & PacificEast Asia & Pacific (excluding high income)East Asia & Pacific (IDA & IBRD countries)EcuadorEgypt, Arab Rep.El SalvadorEquatorial GuineaEritreaEthiopiaEuro areaEurope & Central AsiaEurope & Central Asia (excluding high income)Europe & Central Asia (IDA & IBRD countries)European UnionFijiFragile and conflict affected situationsFrench PolynesiaGabonGambia, TheGeorgiaGhanaGibraltarGrenadaGuatemalaGuineaGuinea-BissauGuyanaHaitiHeavily indebted poor countries (HIPC)High incomeHondurasHong Kong SAR, ChinaIBRD onlyIDA & IBRD totalIDA blendIDA onlyIDA totalIndiaIndonesiaIran, Islamic Rep.IraqIsraelJamaicaJordanKazakhstanKenyaKiribatiKorea, Dem. People’s Rep.Korea, Rep.KosovoKuwaitKyrgyz RepublicLao PDRLatin America & Caribbean Latin America & Caribbean (excluding high income)Latin America & the Caribbean (IDA & IBRD countries)Least developed countries: UN classificationLebanonLesothoLiberiaLibyaLow & middle incomeLow incomeLower middle incomeMacao SAR, ChinaMacedonia, FYRMadagascarMalawiMalaysiaMaldivesMaliMaltaMarshall IslandsMauritaniaMauritiusMexicoMicronesia, Fed. Sts.Middle East & North AfricaMiddle East & North Africa (excluding high income)Middle East & North Africa (IDA & IBRD countries)Middle incomeMoldovaMongoliaMontenegroMoroccoMozambiqueMyanmarNamibiaNauruNepalNew CaledoniaNicaraguaNigerNigeriaNorth AmericaNorthern Mariana IslandsOECD membersOmanOther small statesPacific island small statesPakistanPalauPanamaPapua New GuineaParaguayPeruPhilippinesQatarRwandaSamoaSao Tome and PrincipeSaudi ArabiaSenegalSerbiaSeychellesSierra LeoneSingaporeSloveniaSmall statesSolomon IslandsSomaliaSouth AfricaSouth AsiaSouth Asia (IDA & IBRD)South SudanSri LankaSt. Kitts and NevisSt. LuciaSt. Vincent and the GrenadinesSub-Saharan Africa Sub-Saharan Africa (excluding high income)Sub-Saharan Africa (IDA & IBRD countries)SudanSurinameSwazilandSyrian Arab RepublicTajikistanTanzaniaThailandTimor-LesteTogoTongaTrinidad and TobagoTunisiaTurkeyTurkmenistanTurks and Caicos IslandsTuvaluUgandaUkraineUnited Arab EmiratesUpper middle incomeUruguayUzbekistanVanuatuVenezuela, RBVietnamWest Bank and GazaWorldYemen, Rep.ZambiaZimbabwe Timeline:
This timeline shows a graph from 1961 to 2015 of Chad. No data until 1960. Number of actual observations by date: 55.
Source name:
World Development Indicators
Source organization:
Development Assistance Committee of the Organisation for Economic Co-operation and Development, Geographical Distribution of Financial Flows to Developing Countries, Development Co-operation Report, and International Development Statistics database. Data are available online at: www.oecd.org/dac/stats/idsonline. World Bank population estimates are used for the denominator.
Categories, topics:
Aid Effectiveness, Economy & Growth, External Debt
Last updated:
apr 23, 2017
Indicators value changes by year
Maximum:
52.128
jan 1, 1991
At the date of observation
Value
Absolute change
Change from previous value
jan 1, 1961
0.01
+0.01
0.0%
jan 1, 1962
1.065
+1.055
10.56K%
jan 1, 1963
1.768
+0.703
66.02%
jan 1, 1964
1.746
-0.022
-1.25%
jan 1, 1965
5.096
+3.35
191.89%
jan 1, 1966
5.518
+0.422
8.29%
jan 1, 1967
5.635
+0.117
2.12%
jan 1, 1968
5.771
+0.136
2.41%
jan 1, 1969
6.204
+0.433
7.51%
jan 1, 1970
6.653
+0.449
7.23%
jan 1, 1971
6.132
-0.521
-7.83%
jan 1, 1972
8.159
+2.027
33.05%
jan 1, 1973
8.068
-0.091
-1.11%
jan 1, 1974
11.584
+3.516
43.58%
jan 1, 1975
19.617
+8.033
69.35%
jan 1, 1976
16.32
-3.298
-16.81%
jan 1, 1977
14.589
-1.731
-10.61%
jan 1, 1978
19.178
+4.59
31.46%
jan 1, 1979
28.399
+9.221
48.08%
jan 1, 1980
19.166
-9.234
-32.51%
jan 1, 1981
7.754
-11.412
-59.54%
jan 1, 1982
12.917
+5.164
66.6%
jan 1, 1983
13.602
+0.685
5.31%
jan 1, 1984
18.101
+4.499
33.07%
jan 1, 1985
22.484
+4.383
24.21%
jan 1, 1986
35.159
+12.675
56.37%
jan 1, 1987
30.569
-4.589
-13.05%
jan 1, 1988
37.304
+6.735
22.03%
jan 1, 1989
46.672
+9.368
25.11%
jan 1, 1990
43.432
-3.241
-6.94%
jan 1, 1991
52.128
+8.696
20.02%
jan 1, 1992
42.644
-9.484
-18.19%
jan 1, 1993
37.275
-5.369
-12.59%
jan 1, 1994
34.083
-3.192
-8.56%
jan 1, 1995
31.343
-2.74
-8.04%
jan 1, 1996
33.566
+2.223
7.09%
jan 1, 1997
40.842
+7.276
21.68%
jan 1, 1998
30.405
-10.437
-25.55%
jan 1, 1999
22.47
-7.935
-26.1%
jan 1, 2000
23.357
+0.887
3.95%
jan 1, 2001
15.736
-7.621
-32.63%
jan 1, 2002
21.765
+6.029
38.31%
jan 1, 2003
25.498
+3.734
17.16%
jan 1, 2004
27.107
+1.609
6.31%
jan 1, 2005
34.773
+7.665
28.28%
jan 1, 2006
38.195
+3.422
9.84%
jan 1, 2007
27.749
-10.445
-27.35%
jan 1, 2008
33.313
+5.564
20.05%
jan 1, 2009
37.857
+4.544
13.64%
jan 1, 2010
48.715
+10.857
28.68%
jan 1, 2011
41.244
-7.47
-15.33%
jan 1, 2012
37.244
-4.0
-9.7%
jan 1, 2013
37.148
-0.097
-0.26%
jan 1, 2014
34.823
-2.324
-6.26%
jan 1, 2015
28.582
-6.242
-17.92%
Ranking of countries by current statistics by years


Comments: