29
/
en
AIzaSyAYiBZKx7MnpbEhh9jyipgxe19OcubqV5w
April 1, 2024
167888
Kenya
KEN
true
2
1
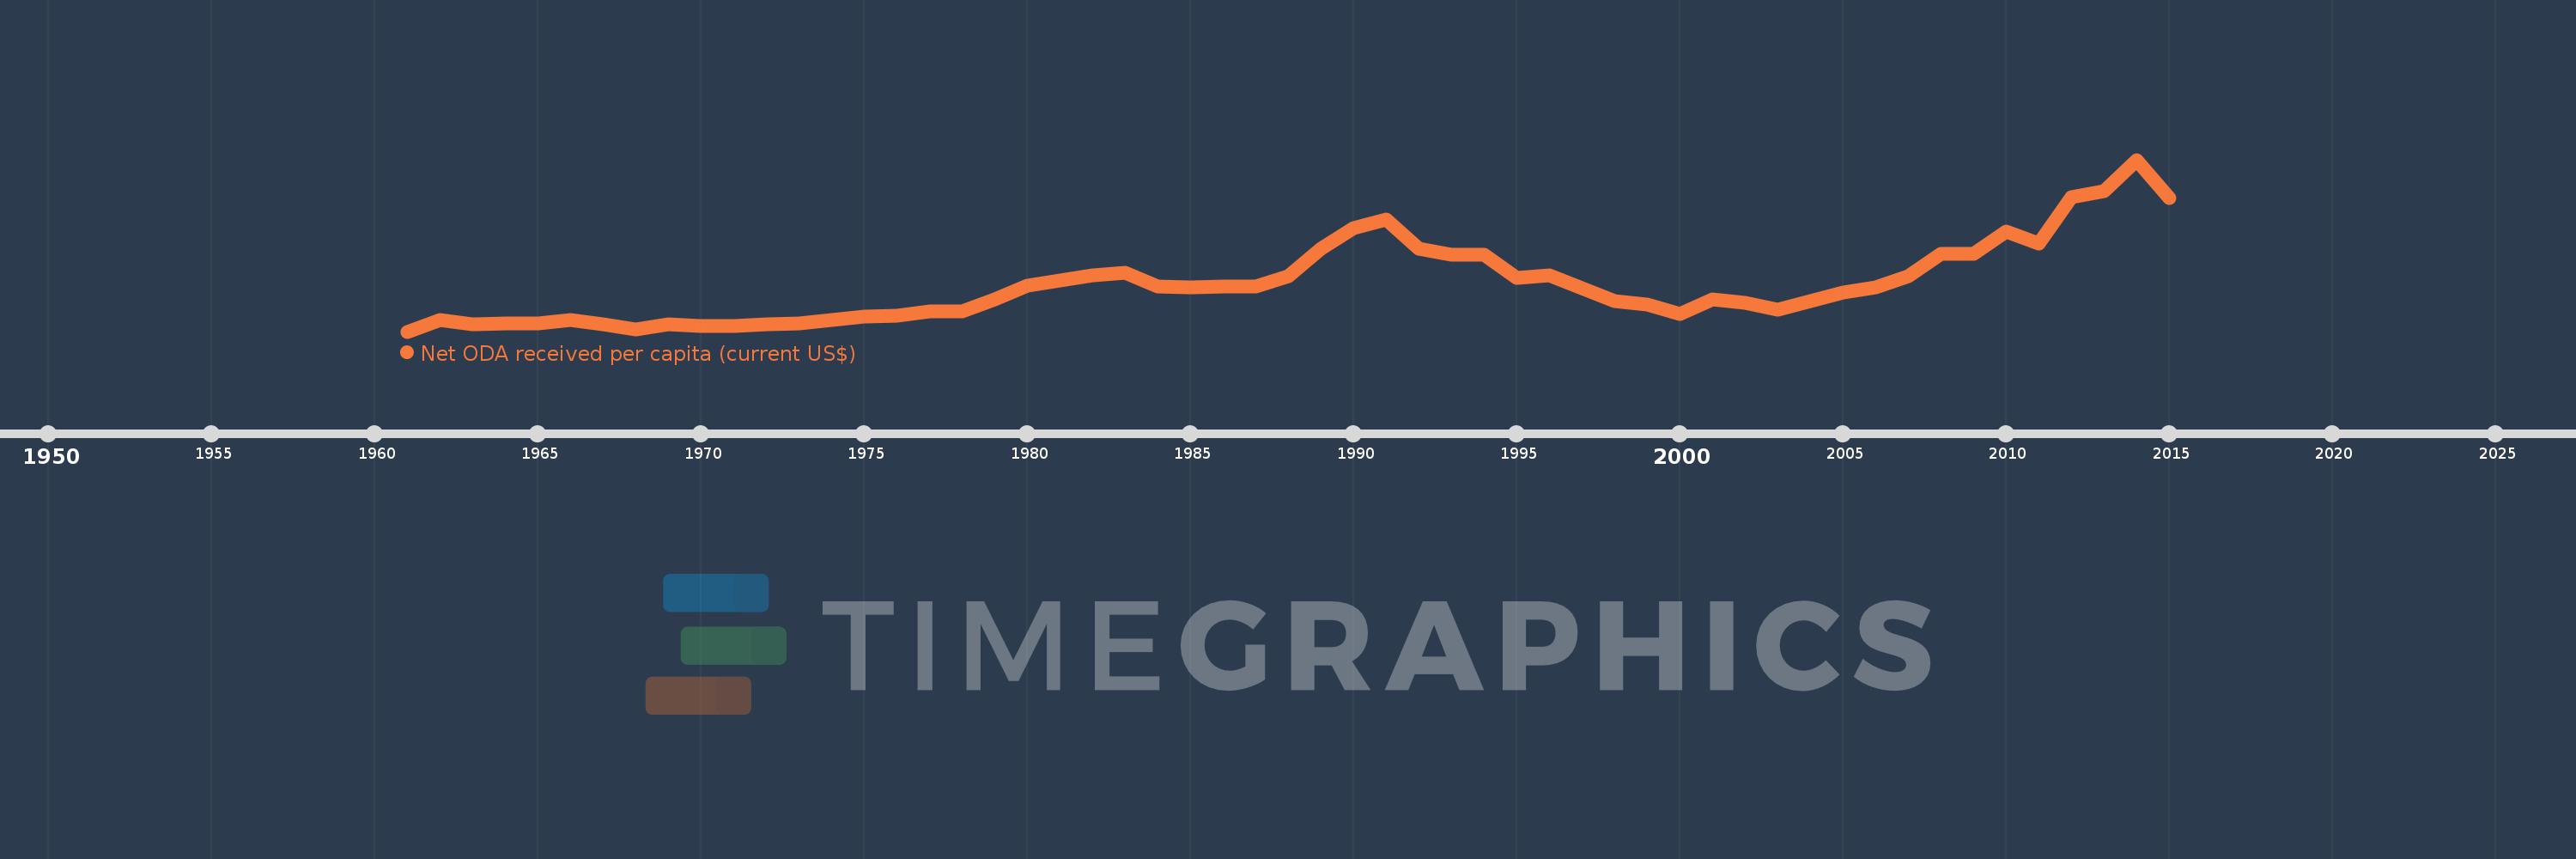
Net ODA received per capita (current US$)
2015,2014,2013,2012,2011,2010,2009,2008,2007,2006,2005,2004,2003,2002,2001,2000,1999,1998,1997,1996,1995,1994,1993,1992,1991,1990,1989,1988,1987,1986,1985,1984,1983,1982,1981,1980,1979,1978,1977,1976,1975,1974,1973,1972,1971,1970,1969,1968,1967,1966,1965,1964,1963,1962,1961
This statistics in other country:
AfghanistanAlbaniaAlgeriaAngolaAntigua and BarbudaArab WorldArgentinaArmeniaArubaAzerbaijanBahamas, TheBahrainBangladeshBarbadosBelarusBelizeBeninBermudaBhutanBoliviaBosnia and HerzegovinaBotswanaBrazilBritish Virgin IslandsBrunei DarussalamBurkina FasoBurundiCabo VerdeCambodiaCameroonCaribbean small statesCayman IslandsCentral African RepublicCentral Europe and the BalticsChadChileChinaColombiaComorosCongo, Dem. Rep.Congo, Rep.Costa RicaCote d'IvoireCroatiaCubaCyprusDjiboutiDominicaDominican RepublicEast Asia & PacificEast Asia & Pacific (excluding high income)East Asia & Pacific (IDA & IBRD countries)EcuadorEgypt, Arab Rep.El SalvadorEquatorial GuineaEritreaEthiopiaEuro areaEurope & Central AsiaEurope & Central Asia (excluding high income)Europe & Central Asia (IDA & IBRD countries)European UnionFijiFragile and conflict affected situationsFrench PolynesiaGabonGambia, TheGeorgiaGhanaGibraltarGrenadaGuatemalaGuineaGuinea-BissauGuyanaHaitiHeavily indebted poor countries (HIPC)High incomeHondurasHong Kong SAR, ChinaIBRD onlyIDA & IBRD totalIDA blendIDA onlyIDA totalIndiaIndonesiaIran, Islamic Rep.IraqIsraelJamaicaJordanKazakhstanKenyaKiribatiKorea, Dem. People’s Rep.Korea, Rep.KosovoKuwaitKyrgyz RepublicLao PDRLatin America & Caribbean Latin America & Caribbean (excluding high income)Latin America & the Caribbean (IDA & IBRD countries)Least developed countries: UN classificationLebanonLesothoLiberiaLibyaLow & middle incomeLow incomeLower middle incomeMacao SAR, ChinaMacedonia, FYRMadagascarMalawiMalaysiaMaldivesMaliMaltaMarshall IslandsMauritaniaMauritiusMexicoMicronesia, Fed. Sts.Middle East & North AfricaMiddle East & North Africa (excluding high income)Middle East & North Africa (IDA & IBRD countries)Middle incomeMoldovaMongoliaMontenegroMoroccoMozambiqueMyanmarNamibiaNauruNepalNew CaledoniaNicaraguaNigerNigeriaNorth AmericaNorthern Mariana IslandsOECD membersOmanOther small statesPacific island small statesPakistanPalauPanamaPapua New GuineaParaguayPeruPhilippinesQatarRwandaSamoaSao Tome and PrincipeSaudi ArabiaSenegalSerbiaSeychellesSierra LeoneSingaporeSloveniaSmall statesSolomon IslandsSomaliaSouth AfricaSouth AsiaSouth Asia (IDA & IBRD)South SudanSri LankaSt. Kitts and NevisSt. LuciaSt. Vincent and the GrenadinesSub-Saharan Africa Sub-Saharan Africa (excluding high income)Sub-Saharan Africa (IDA & IBRD countries)SudanSurinameSwazilandSyrian Arab RepublicTajikistanTanzaniaThailandTimor-LesteTogoTongaTrinidad and TobagoTunisiaTurkeyTurkmenistanTurks and Caicos IslandsTuvaluUgandaUkraineUnited Arab EmiratesUpper middle incomeUruguayUzbekistanVanuatuVenezuela, RBVietnamWest Bank and GazaWorldYemen, Rep.ZambiaZimbabwe Timeline:
This timeline shows a graph from 1961 to 2015 of Kenya. No data until 1960. Number of actual observations by date: 55.
Source name:
World Development Indicators
Source organization:
Development Assistance Committee of the Organisation for Economic Co-operation and Development, Geographical Distribution of Financial Flows to Developing Countries, Development Co-operation Report, and International Development Statistics database. Data are available online at: www.oecd.org/dac/stats/idsonline. World Bank population estimates are used for the denominator.
Categories, topics:
Aid Effectiveness, Economy & Growth, External Debt
Last updated:
apr 23, 2017
Indicators value changes by year
Maximum:
75.793
jan 1, 2014
At the date of observation
Value
Absolute change
Change from previous value
jan 1, 1961
2.604
+2.604
0.0%
jan 1, 1962
7.562
+4.958
190.36%
jan 1, 1963
5.692
-1.87
-24.72%
jan 1, 1964
6.24
+0.548
9.62%
jan 1, 1965
6.164
-0.076
-1.22%
jan 1, 1966
7.589
+1.425
23.12%
jan 1, 1967
5.641
-1.948
-25.67%
jan 1, 1968
3.615
-2.026
-35.91%
jan 1, 1969
5.781
+2.166
59.9%
jan 1, 1970
5.135
-0.645
-11.16%
jan 1, 1971
5.097
-0.039
-0.75%
jan 1, 1972
5.735
+0.638
12.52%
jan 1, 1973
5.947
+0.213
3.71%
jan 1, 1974
7.58
+1.632
27.45%
jan 1, 1975
8.969
+1.39
18.34%
jan 1, 1976
9.255
+0.286
3.19%
jan 1, 1977
11.046
+1.791
19.35%
jan 1, 1978
11.066
+0.02
0.18%
jan 1, 1979
16.285
+5.219
47.16%
jan 1, 1980
22.242
+5.957
36.58%
jan 1, 1981
24.268
+2.026
9.11%
jan 1, 1982
26.516
+2.248
9.26%
jan 1, 1983
27.597
+1.081
4.08%
jan 1, 1984
21.714
-5.883
-21.32%
jan 1, 1985
21.561
-0.153
-0.7%
jan 1, 1986
21.701
+0.14
0.65%
jan 1, 1987
21.72
+0.019
0.09%
jan 1, 1988
26.358
+4.638
21.35%
jan 1, 1989
37.994
+11.636
44.15%
jan 1, 1990
46.748
+8.754
23.04%
jan 1, 1991
50.383
+3.635
7.78%
jan 1, 1992
37.817
-12.566
-24.94%
jan 1, 1993
35.284
-2.533
-6.7%
jan 1, 1994
35.408
+0.124
0.35%
jan 1, 1995
25.429
-9.978
-28.18%
jan 1, 1996
26.736
+1.307
5.14%
jan 1, 1997
21.163
-5.573
-20.84%
jan 1, 1998
15.554
-5.609
-26.51%
jan 1, 1999
14.044
-1.509
-9.7%
jan 1, 2000
10.246
-3.798
-27.04%
jan 1, 2001
16.504
+6.258
61.08%
jan 1, 2002
14.789
-1.715
-10.39%
jan 1, 2003
12.015
-2.774
-18.75%
jan 1, 2004
15.588
+3.573
29.73%
jan 1, 2005
19.172
+3.584
22.99%
jan 1, 2006
21.477
+2.305
12.02%
jan 1, 2007
26.09
+4.613
21.48%
jan 1, 2008
35.618
+9.528
36.52%
jan 1, 2009
35.717
+0.099
0.28%
jan 1, 2010
45.23
+9.514
26.64%
jan 1, 2011
40.286
-4.945
-10.93%
jan 1, 2012
59.889
+19.603
48.66%
jan 1, 2013
62.361
+2.472
4.13%
jan 1, 2014
75.793
+13.432
21.54%
jan 1, 2015
59.405
-16.388
-21.62%
Ranking of countries by current statistics by years


Comments: