29
/
en
AIzaSyAYiBZKx7MnpbEhh9jyipgxe19OcubqV5w
April 1, 2024
262659
Thailand
THA
true
2
1
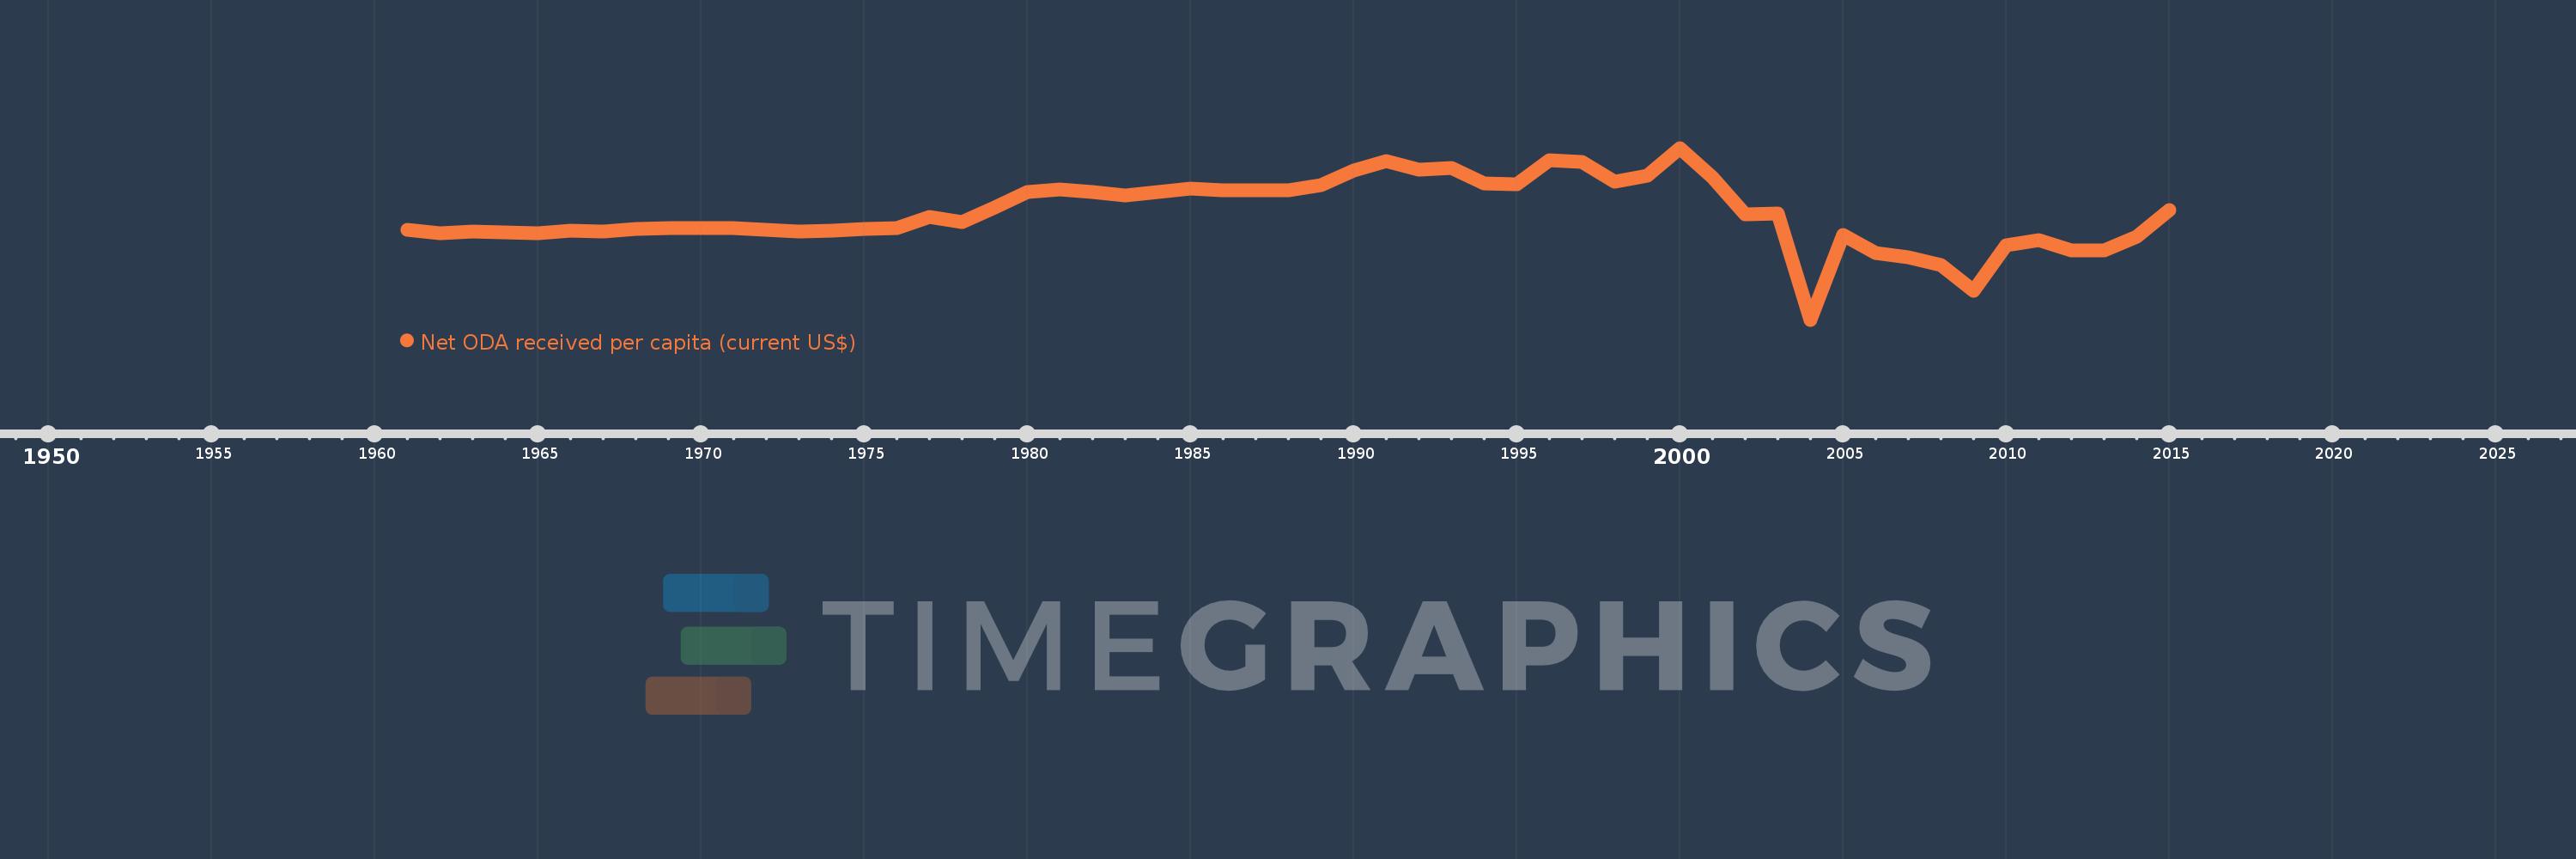
Net ODA received per capita (current US$)
2015,2014,2013,2012,2011,2010,2009,2008,2007,2006,2005,2004,2003,2002,2001,2000,1999,1998,1997,1996,1995,1994,1993,1992,1991,1990,1989,1988,1987,1986,1985,1984,1983,1982,1981,1980,1979,1978,1977,1976,1975,1974,1973,1972,1971,1970,1969,1968,1967,1966,1965,1964,1963,1962,1961
This statistics in other country:
AfghanistanAlbaniaAlgeriaAngolaAntigua and BarbudaArab WorldArgentinaArmeniaArubaAzerbaijanBahamas, TheBahrainBangladeshBarbadosBelarusBelizeBeninBermudaBhutanBoliviaBosnia and HerzegovinaBotswanaBrazilBritish Virgin IslandsBrunei DarussalamBurkina FasoBurundiCabo VerdeCambodiaCameroonCaribbean small statesCayman IslandsCentral African RepublicCentral Europe and the BalticsChadChileChinaColombiaComorosCongo, Dem. Rep.Congo, Rep.Costa RicaCote d'IvoireCroatiaCubaCyprusDjiboutiDominicaDominican RepublicEast Asia & PacificEast Asia & Pacific (excluding high income)East Asia & Pacific (IDA & IBRD countries)EcuadorEgypt, Arab Rep.El SalvadorEquatorial GuineaEritreaEthiopiaEuro areaEurope & Central AsiaEurope & Central Asia (excluding high income)Europe & Central Asia (IDA & IBRD countries)European UnionFijiFragile and conflict affected situationsFrench PolynesiaGabonGambia, TheGeorgiaGhanaGibraltarGrenadaGuatemalaGuineaGuinea-BissauGuyanaHaitiHeavily indebted poor countries (HIPC)High incomeHondurasHong Kong SAR, ChinaIBRD onlyIDA & IBRD totalIDA blendIDA onlyIDA totalIndiaIndonesiaIran, Islamic Rep.IraqIsraelJamaicaJordanKazakhstanKenyaKiribatiKorea, Dem. People’s Rep.Korea, Rep.KosovoKuwaitKyrgyz RepublicLao PDRLatin America & Caribbean Latin America & Caribbean (excluding high income)Latin America & the Caribbean (IDA & IBRD countries)Least developed countries: UN classificationLebanonLesothoLiberiaLibyaLow & middle incomeLow incomeLower middle incomeMacao SAR, ChinaMacedonia, FYRMadagascarMalawiMalaysiaMaldivesMaliMaltaMarshall IslandsMauritaniaMauritiusMexicoMicronesia, Fed. Sts.Middle East & North AfricaMiddle East & North Africa (excluding high income)Middle East & North Africa (IDA & IBRD countries)Middle incomeMoldovaMongoliaMontenegroMoroccoMozambiqueMyanmarNamibiaNauruNepalNew CaledoniaNicaraguaNigerNigeriaNorth AmericaNorthern Mariana IslandsOECD membersOmanOther small statesPacific island small statesPakistanPalauPanamaPapua New GuineaParaguayPeruPhilippinesQatarRwandaSamoaSao Tome and PrincipeSaudi ArabiaSenegalSerbiaSeychellesSierra LeoneSingaporeSloveniaSmall statesSolomon IslandsSomaliaSouth AfricaSouth AsiaSouth Asia (IDA & IBRD)South SudanSri LankaSt. Kitts and NevisSt. LuciaSt. Vincent and the GrenadinesSub-Saharan Africa Sub-Saharan Africa (excluding high income)Sub-Saharan Africa (IDA & IBRD countries)SudanSurinameSwazilandSyrian Arab RepublicTajikistanTanzaniaThailandTimor-LesteTogoTongaTrinidad and TobagoTunisiaTurkeyTurkmenistanTurks and Caicos IslandsTuvaluUgandaUkraineUnited Arab EmiratesUpper middle incomeUruguayUzbekistanVanuatuVenezuela, RBVietnamWest Bank and GazaWorldYemen, Rep.ZambiaZimbabwe Timeline:
This timeline shows a graph from 1961 to 2015 of Thailand. No data until 1960. Number of actual observations by date: 55.
Source name:
World Development Indicators
Source organization:
Development Assistance Committee of the Organisation for Economic Co-operation and Development, Geographical Distribution of Financial Flows to Developing Countries, Development Co-operation Report, and International Development Statistics database. Data are available online at: www.oecd.org/dac/stats/idsonline. World Bank population estimates are used for the denominator.
Categories, topics:
Aid Effectiveness, Economy & Growth, External Debt
Last updated:
apr 23, 2017
Indicators value changes by year
Minimum:
-14.551
jan 1, 2004
Maximum:
16.355
jan 1, 2000
At the date of observation
Value
Absolute change
Change from previous value
jan 1, 1961
1.598
+1.598
0.0%
jan 1, 1962
1.04
-0.558
-34.95%
jan 1, 1963
1.303
+0.263
25.34%
jan 1, 1964
1.212
-0.091
-6.95%
jan 1, 1965
1.031
-0.181
-14.93%
jan 1, 1966
1.543
+0.511
49.57%
jan 1, 1967
1.29
-0.253
-16.37%
jan 1, 1968
1.723
+0.433
33.58%
jan 1, 1969
2.014
+0.291
16.87%
jan 1, 1970
1.905
-0.109
-5.41%
jan 1, 1971
2.006
+0.101
5.3%
jan 1, 1972
1.652
-0.354
-17.67%
jan 1, 1973
1.373
-0.278
-16.84%
jan 1, 1974
1.514
+0.14
10.2%
jan 1, 1975
1.717
+0.204
13.47%
jan 1, 1976
1.998
+0.28
16.33%
jan 1, 1977
3.879
+1.881
94.15%
jan 1, 1978
2.969
-0.91
-23.47%
jan 1, 1979
5.697
+2.729
91.92%
jan 1, 1980
8.426
+2.729
47.9%
jan 1, 1981
8.816
+0.39
4.63%
jan 1, 1982
8.383
-0.433
-4.91%
jan 1, 1983
7.86
-0.523
-6.24%
jan 1, 1984
8.496
+0.636
8.09%
jan 1, 1985
9.019
+0.523
6.16%
jan 1, 1986
8.789
-0.23
-2.55%
jan 1, 1987
8.76
-0.029
-0.33%
jan 1, 1988
8.675
-0.085
-0.97%
jan 1, 1989
9.679
+1.004
11.58%
jan 1, 1990
12.304
+2.625
27.12%
jan 1, 1991
14.06
+1.756
14.27%
jan 1, 1992
12.469
-1.591
-11.32%
jan 1, 1993
12.774
+0.304
2.44%
jan 1, 1994
9.971
-2.803
-21.94%
jan 1, 1995
9.819
-0.152
-1.52%
jan 1, 1996
14.124
+4.305
43.84%
jan 1, 1997
13.83
-0.293
-2.08%
jan 1, 1998
10.294
-3.537
-25.57%
jan 1, 1999
11.398
+1.105
10.73%
jan 1, 2000
16.355
+4.957
43.49%
jan 1, 2001
11.112
-5.243
-32.06%
jan 1, 2002
4.421
-6.691
-60.21%
jan 1, 2003
4.573
+0.152
3.45%
jan 1, 2004
-14.551
-19.124
-418.17%
jan 1, 2005
0.724
+15.275
-104.97%
jan 1, 2006
-2.546
-3.269
-451.77%
jan 1, 2007
-3.28
-0.734
28.85%
jan 1, 2008
-4.687
-1.407
42.9%
jan 1, 2009
-9.307
-4.621
98.59%
jan 1, 2010
-1.168
+8.139
-87.45%
jan 1, 2011
-0.181
+0.987
-84.47%
jan 1, 2012
-2.057
-1.875
1.03K%
jan 1, 2013
-2.006
+0.05
-2.44%
jan 1, 2014
0.388
+2.395
-119.36%
jan 1, 2015
5.185
+4.797
1.23K%
Ranking of countries by current statistics by years


Comments: