29
/
en
AIzaSyAYiBZKx7MnpbEhh9jyipgxe19OcubqV5w
April 1, 2024
189344
Maldives
MDV
true
2
1
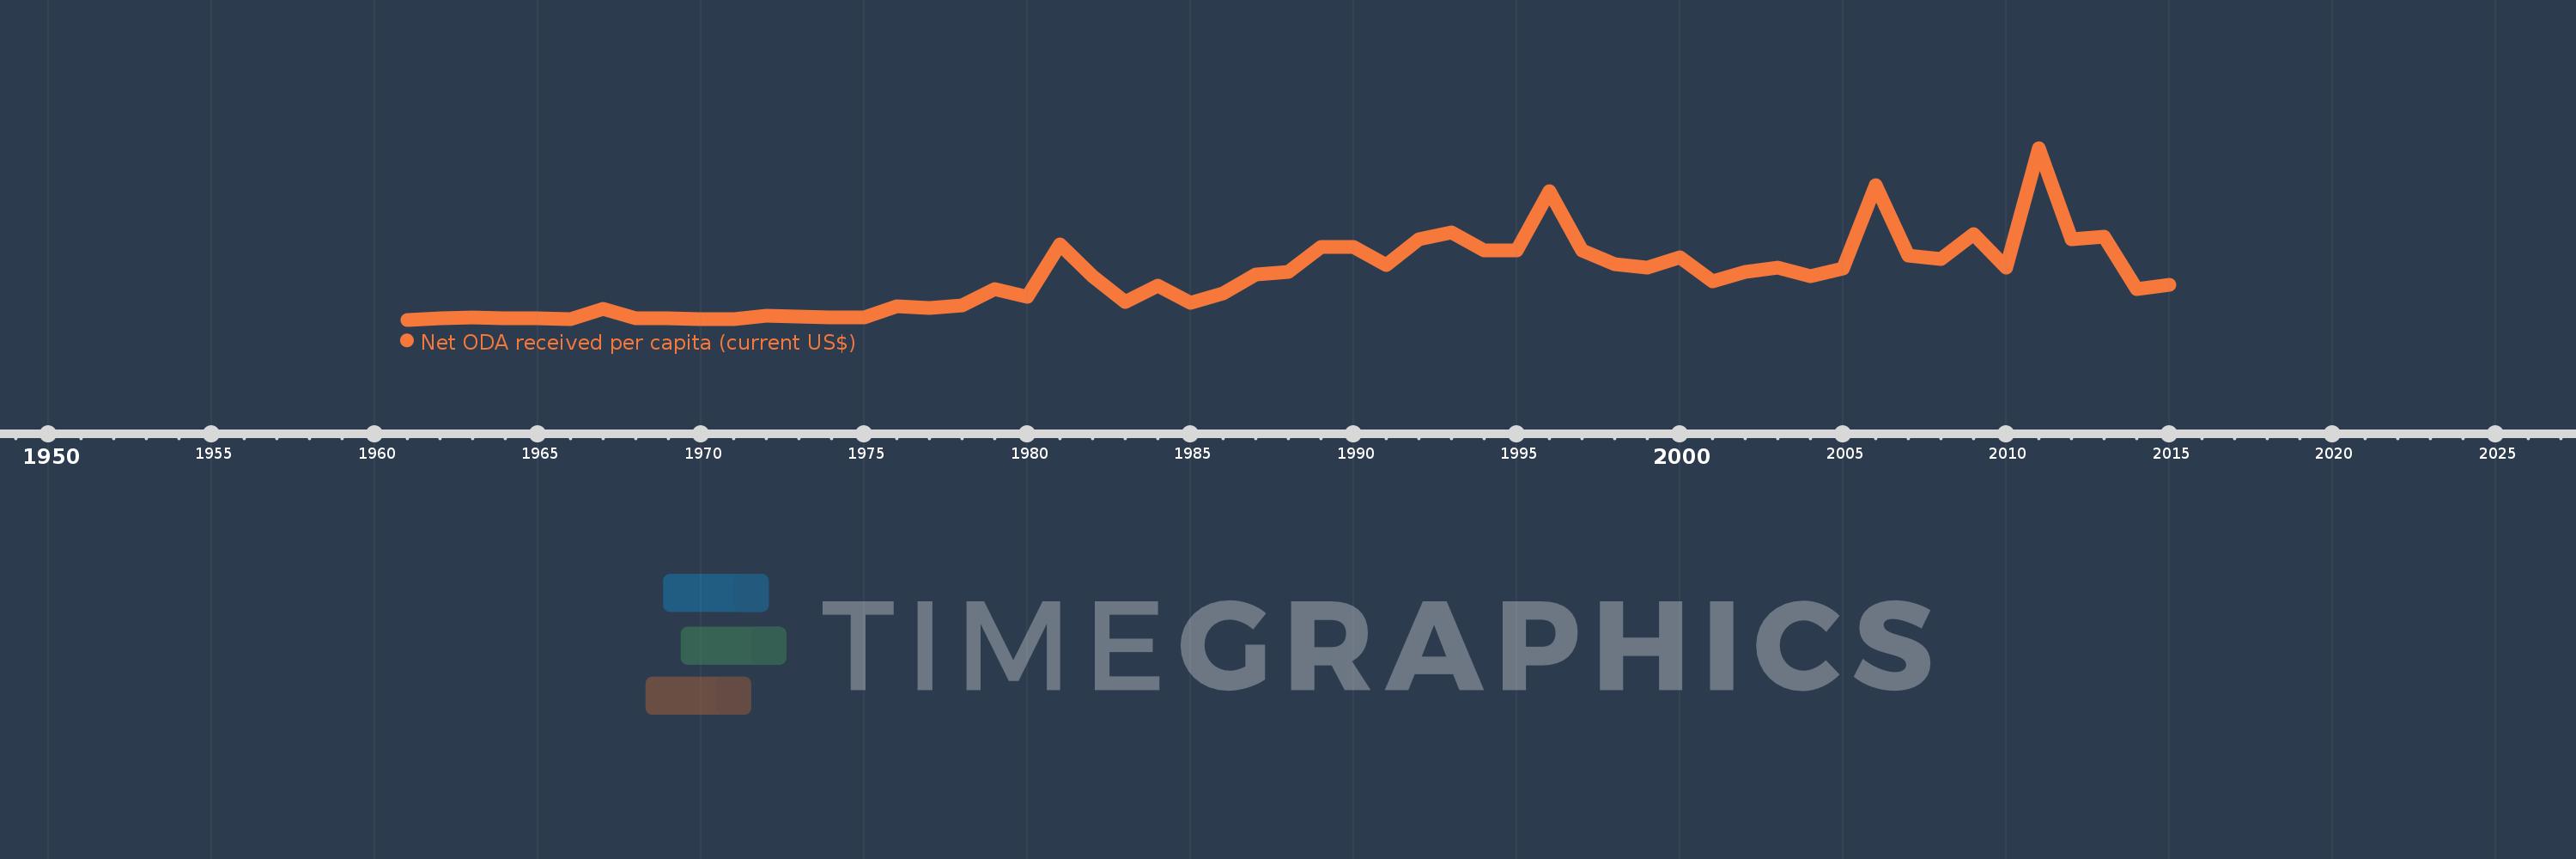
Net ODA received per capita (current US$)
2015,2014,2013,2012,2011,2010,2009,2008,2007,2006,2005,2004,2003,2002,2001,2000,1999,1998,1997,1996,1995,1994,1993,1992,1991,1990,1989,1988,1987,1986,1985,1984,1983,1982,1981,1980,1979,1978,1977,1976,1975,1974,1973,1972,1971,1970,1969,1968,1967,1966,1965,1964,1963,1962,1961
This statistics in other country:
AfghanistanAlbaniaAlgeriaAngolaAntigua and BarbudaArab WorldArgentinaArmeniaArubaAzerbaijanBahamas, TheBahrainBangladeshBarbadosBelarusBelizeBeninBermudaBhutanBoliviaBosnia and HerzegovinaBotswanaBrazilBritish Virgin IslandsBrunei DarussalamBurkina FasoBurundiCabo VerdeCambodiaCameroonCaribbean small statesCayman IslandsCentral African RepublicCentral Europe and the BalticsChadChileChinaColombiaComorosCongo, Dem. Rep.Congo, Rep.Costa RicaCote d'IvoireCroatiaCubaCyprusDjiboutiDominicaDominican RepublicEast Asia & PacificEast Asia & Pacific (excluding high income)East Asia & Pacific (IDA & IBRD countries)EcuadorEgypt, Arab Rep.El SalvadorEquatorial GuineaEritreaEthiopiaEuro areaEurope & Central AsiaEurope & Central Asia (excluding high income)Europe & Central Asia (IDA & IBRD countries)European UnionFijiFragile and conflict affected situationsFrench PolynesiaGabonGambia, TheGeorgiaGhanaGibraltarGrenadaGuatemalaGuineaGuinea-BissauGuyanaHaitiHeavily indebted poor countries (HIPC)High incomeHondurasHong Kong SAR, ChinaIBRD onlyIDA & IBRD totalIDA blendIDA onlyIDA totalIndiaIndonesiaIran, Islamic Rep.IraqIsraelJamaicaJordanKazakhstanKenyaKiribatiKorea, Dem. People’s Rep.Korea, Rep.KosovoKuwaitKyrgyz RepublicLao PDRLatin America & Caribbean Latin America & Caribbean (excluding high income)Latin America & the Caribbean (IDA & IBRD countries)Least developed countries: UN classificationLebanonLesothoLiberiaLibyaLow & middle incomeLow incomeLower middle incomeMacao SAR, ChinaMacedonia, FYRMadagascarMalawiMalaysiaMaldivesMaliMaltaMarshall IslandsMauritaniaMauritiusMexicoMicronesia, Fed. Sts.Middle East & North AfricaMiddle East & North Africa (excluding high income)Middle East & North Africa (IDA & IBRD countries)Middle incomeMoldovaMongoliaMontenegroMoroccoMozambiqueMyanmarNamibiaNauruNepalNew CaledoniaNicaraguaNigerNigeriaNorth AmericaNorthern Mariana IslandsOECD membersOmanOther small statesPacific island small statesPakistanPalauPanamaPapua New GuineaParaguayPeruPhilippinesQatarRwandaSamoaSao Tome and PrincipeSaudi ArabiaSenegalSerbiaSeychellesSierra LeoneSingaporeSloveniaSmall statesSolomon IslandsSomaliaSouth AfricaSouth AsiaSouth Asia (IDA & IBRD)South SudanSri LankaSt. Kitts and NevisSt. LuciaSt. Vincent and the GrenadinesSub-Saharan Africa Sub-Saharan Africa (excluding high income)Sub-Saharan Africa (IDA & IBRD countries)SudanSurinameSwazilandSyrian Arab RepublicTajikistanTanzaniaThailandTimor-LesteTogoTongaTrinidad and TobagoTunisiaTurkeyTurkmenistanTurks and Caicos IslandsTuvaluUgandaUkraineUnited Arab EmiratesUpper middle incomeUruguayUzbekistanVanuatuVenezuela, RBVietnamWest Bank and GazaWorldYemen, Rep.ZambiaZimbabwe Timeline:
This timeline shows a graph from 1961 to 2015 of Maldives. No data until 1960. Number of actual observations by date: 55.
Source name:
World Development Indicators
Source organization:
Development Assistance Committee of the Organisation for Economic Co-operation and Development, Geographical Distribution of Financial Flows to Developing Countries, Development Co-operation Report, and International Development Statistics database. Data are available online at: www.oecd.org/dac/stats/idsonline. World Bank population estimates are used for the denominator.
Categories, topics:
Aid Effectiveness, Economy & Growth, External Debt
Last updated:
apr 23, 2017
Indicators value changes by year
Maximum:
301.771
jan 1, 2011
At the date of observation
Value
Absolute change
Change from previous value
jan 1, 1961
0.334
+0.334
0.0%
jan 1, 1962
2.816
+2.482
743.65%
jan 1, 1963
5.057
+2.241
79.59%
jan 1, 1964
3.075
-1.982
-39.2%
jan 1, 1965
2.795
-0.28
-9.11%
jan 1, 1966
1.168
-1.627
-58.21%
jan 1, 1967
18.926
+17.758
1.52K%
jan 1, 1968
3.442
-15.484
-81.81%
jan 1, 1969
2.639
-0.804
-23.34%
jan 1, 1970
1.51
-1.129
-42.78%
jan 1, 1971
2.074
+0.564
37.38%
jan 1, 1972
7.124
+5.05
243.45%
jan 1, 1973
5.188
-1.936
-27.18%
jan 1, 1974
4.541
-0.646
-12.46%
jan 1, 1975
4.617
+0.076
1.67%
jan 1, 1976
23.821
+19.204
415.95%
jan 1, 1977
21.411
-2.41
-10.12%
jan 1, 1978
25.234
+3.823
17.86%
jan 1, 1979
54.437
+29.202
115.73%
jan 1, 1980
40.969
-13.467
-24.74%
jan 1, 1981
132.106
+91.137
222.45%
jan 1, 1982
77.334
-54.772
-41.46%
jan 1, 1983
31.084
-46.25
-59.81%
jan 1, 1984
60.309
+29.225
94.02%
jan 1, 1985
29.64
-30.67
-50.85%
jan 1, 1986
46.373
+16.733
56.46%
jan 1, 1987
80.343
+33.97
73.26%
jan 1, 1988
83.572
+3.229
4.02%
jan 1, 1989
127.34
+43.768
52.37%
jan 1, 1990
128.052
+0.712
0.56%
jan 1, 1991
95.688
-32.364
-25.27%
jan 1, 1992
141.85
+46.162
48.24%
jan 1, 1993
153.846
+11.996
8.46%
jan 1, 1994
121.24
-32.606
-21.19%
jan 1, 1995
121.306
+0.066
0.05%
jan 1, 1996
226.471
+105.164
86.69%
jan 1, 1997
122.557
-103.913
-45.88%
jan 1, 1998
98.106
-24.451
-19.95%
jan 1, 1999
92.251
-5.855
-5.97%
jan 1, 2000
109.571
+17.321
18.78%
jan 1, 2001
66.958
-42.613
-38.89%
jan 1, 2002
84.829
+17.871
26.69%
jan 1, 2003
92.458
+7.629
8.99%
jan 1, 2004
76.447
-16.011
-17.32%
jan 1, 2005
90.481
+14.033
18.36%
jan 1, 2006
236.199
+145.719
161.05%
jan 1, 2007
112.673
-123.527
-52.3%
jan 1, 2008
107.364
-5.309
-4.71%
jan 1, 2009
150.249
+42.885
39.94%
jan 1, 2010
92.222
-58.026
-38.62%
jan 1, 2011
301.771
+209.549
227.22%
jan 1, 2012
141.432
-160.339
-53.13%
jan 1, 2013
146.831
+5.399
3.82%
jan 1, 2014
53.919
-92.913
-63.28%
jan 1, 2015
61.796
+7.877
14.61%
Ranking of countries by current statistics by years


Comments: