29
/
en
AIzaSyAYiBZKx7MnpbEhh9jyipgxe19OcubqV5w
April 1, 2024
169404
Korea, Dem. People’s Rep.
PRK
true
2
1
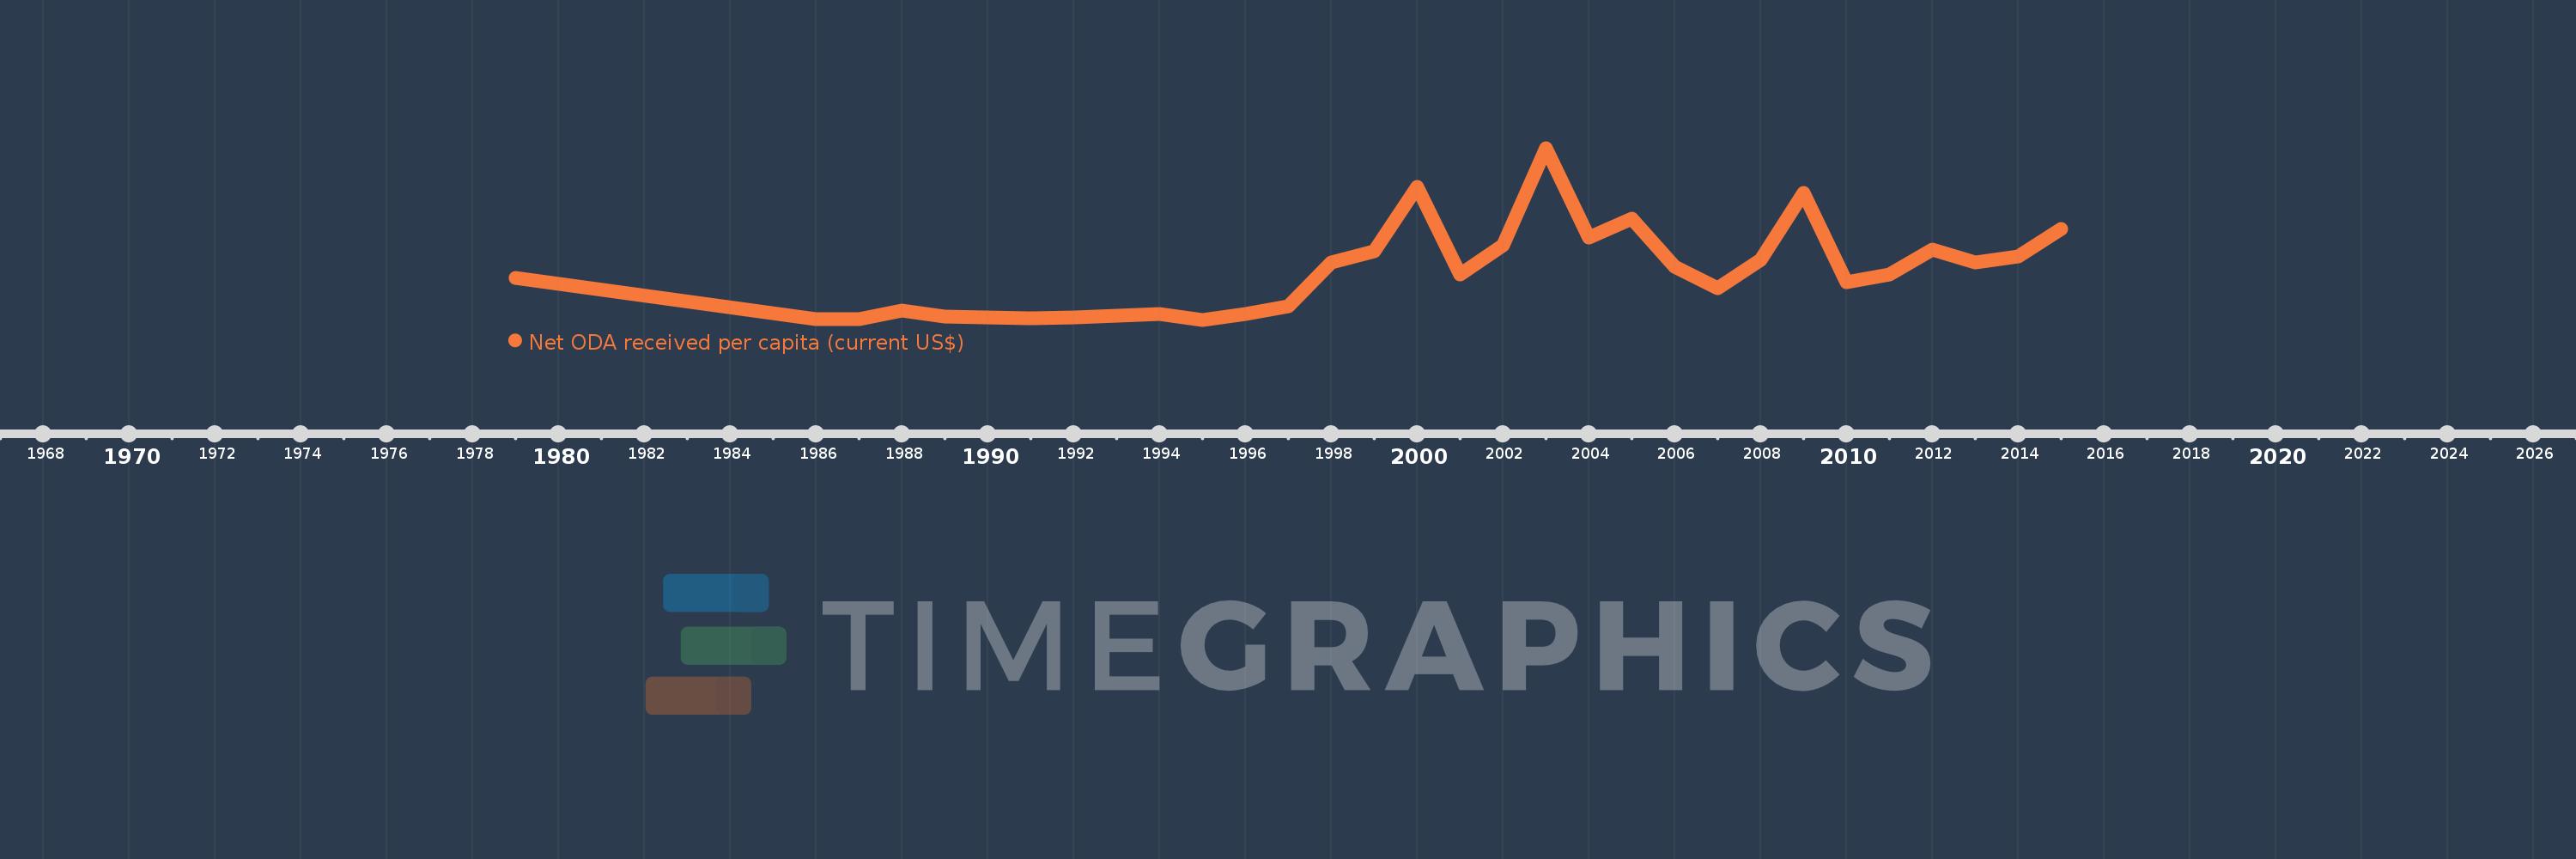
Net ODA received per capita (current US$)
2015,2014,2013,2012,2011,2010,2009,2008,2007,2006,2005,2004,2003,2002,2001,2000,1999,1998,1997,1996,1995,1994,1993,1992,1991,1990,1989,1988,1987,1986,1979
This statistics in other country:
AfghanistanAlbaniaAlgeriaAngolaAntigua and BarbudaArab WorldArgentinaArmeniaArubaAzerbaijanBahamas, TheBahrainBangladeshBarbadosBelarusBelizeBeninBermudaBhutanBoliviaBosnia and HerzegovinaBotswanaBrazilBritish Virgin IslandsBrunei DarussalamBurkina FasoBurundiCabo VerdeCambodiaCameroonCaribbean small statesCayman IslandsCentral African RepublicCentral Europe and the BalticsChadChileChinaColombiaComorosCongo, Dem. Rep.Congo, Rep.Costa RicaCote d'IvoireCroatiaCubaCyprusDjiboutiDominicaDominican RepublicEast Asia & PacificEast Asia & Pacific (excluding high income)East Asia & Pacific (IDA & IBRD countries)EcuadorEgypt, Arab Rep.El SalvadorEquatorial GuineaEritreaEthiopiaEuro areaEurope & Central AsiaEurope & Central Asia (excluding high income)Europe & Central Asia (IDA & IBRD countries)European UnionFijiFragile and conflict affected situationsFrench PolynesiaGabonGambia, TheGeorgiaGhanaGibraltarGrenadaGuatemalaGuineaGuinea-BissauGuyanaHaitiHeavily indebted poor countries (HIPC)High incomeHondurasHong Kong SAR, ChinaIBRD onlyIDA & IBRD totalIDA blendIDA onlyIDA totalIndiaIndonesiaIran, Islamic Rep.IraqIsraelJamaicaJordanKazakhstanKenyaKiribatiKorea, Dem. People’s Rep.Korea, Rep.KosovoKuwaitKyrgyz RepublicLao PDRLatin America & Caribbean Latin America & Caribbean (excluding high income)Latin America & the Caribbean (IDA & IBRD countries)Least developed countries: UN classificationLebanonLesothoLiberiaLibyaLow & middle incomeLow incomeLower middle incomeMacao SAR, ChinaMacedonia, FYRMadagascarMalawiMalaysiaMaldivesMaliMaltaMarshall IslandsMauritaniaMauritiusMexicoMicronesia, Fed. Sts.Middle East & North AfricaMiddle East & North Africa (excluding high income)Middle East & North Africa (IDA & IBRD countries)Middle incomeMoldovaMongoliaMontenegroMoroccoMozambiqueMyanmarNamibiaNauruNepalNew CaledoniaNicaraguaNigerNigeriaNorth AmericaNorthern Mariana IslandsOECD membersOmanOther small statesPacific island small statesPakistanPalauPanamaPapua New GuineaParaguayPeruPhilippinesQatarRwandaSamoaSao Tome and PrincipeSaudi ArabiaSenegalSerbiaSeychellesSierra LeoneSingaporeSloveniaSmall statesSolomon IslandsSomaliaSouth AfricaSouth AsiaSouth Asia (IDA & IBRD)South SudanSri LankaSt. Kitts and NevisSt. LuciaSt. Vincent and the GrenadinesSub-Saharan Africa Sub-Saharan Africa (excluding high income)Sub-Saharan Africa (IDA & IBRD countries)SudanSurinameSwazilandSyrian Arab RepublicTajikistanTanzaniaThailandTimor-LesteTogoTongaTrinidad and TobagoTunisiaTurkeyTurkmenistanTurks and Caicos IslandsTuvaluUgandaUkraineUnited Arab EmiratesUpper middle incomeUruguayUzbekistanVanuatuVenezuela, RBVietnamWest Bank and GazaWorldYemen, Rep.ZambiaZimbabwe Timeline:
This timeline shows a graph from 1979 to 2015 of Korea, Dem. People’s Rep.. No data until 1978. Number of actual observations by date: 31.
Source name:
World Development Indicators
Source organization:
Development Assistance Committee of the Organisation for Economic Co-operation and Development, Geographical Distribution of Financial Flows to Developing Countries, Development Co-operation Report, and International Development Statistics database. Data are available online at: www.oecd.org/dac/stats/idsonline. World Bank population estimates are used for the denominator.
Categories, topics:
Aid Effectiveness, Economy & Growth, External Debt
Last updated:
apr 23, 2017
Indicators value changes by year
Maximum:
11.389
jan 1, 2003
At the date of observation
Value
Absolute change
Change from previous value
jan 1, 1979
2.949
+2.949
0.0%
jan 1, 1986
0.293
-2.656
-90.05%
jan 1, 1987
0.285
-0.009
-2.9%
jan 1, 1988
0.848
+0.563
197.72%
jan 1, 1989
0.461
-0.387
-45.65%
jan 1, 1990
0.418
-0.043
-9.39%
jan 1, 1991
0.383
-0.035
-8.36%
jan 1, 1992
0.42
+0.037
9.8%
jan 1, 1993
0.508
+0.088
20.92%
jan 1, 1994
0.664
+0.156
30.71%
jan 1, 1995
0.264
-0.401
-60.33%
jan 1, 1996
0.619
+0.356
135.04%
jan 1, 1997
1.161
+0.542
87.51%
jan 1, 1998
3.969
+2.808
241.77%
jan 1, 1999
4.683
+0.714
17.98%
jan 1, 2000
8.868
+4.185
89.36%
jan 1, 2001
3.209
-5.658
-63.81%
jan 1, 2002
5.105
+1.896
59.08%
jan 1, 2003
11.389
+6.284
123.09%
jan 1, 2004
5.586
-5.803
-50.95%
jan 1, 2005
6.816
+1.23
22.02%
jan 1, 2006
3.677
-3.139
-46.06%
jan 1, 2007
2.28
-1.397
-37.99%
jan 1, 2008
4.118
+1.838
80.61%
jan 1, 2009
8.505
+4.387
106.53%
jan 1, 2010
2.676
-5.829
-68.54%
jan 1, 2011
3.217
+0.541
20.23%
jan 1, 2012
4.815
+1.597
49.64%
jan 1, 2013
3.963
-0.852
-17.69%
jan 1, 2014
4.389
+0.426
10.76%
jan 1, 2015
6.131
+1.742
39.69%
Ranking of countries by current statistics by years


Comments: