29
/
en
AIzaSyAYiBZKx7MnpbEhh9jyipgxe19OcubqV5w
April 1, 2024
271197
Turks and Caicos Islands
TCA
true
2
1
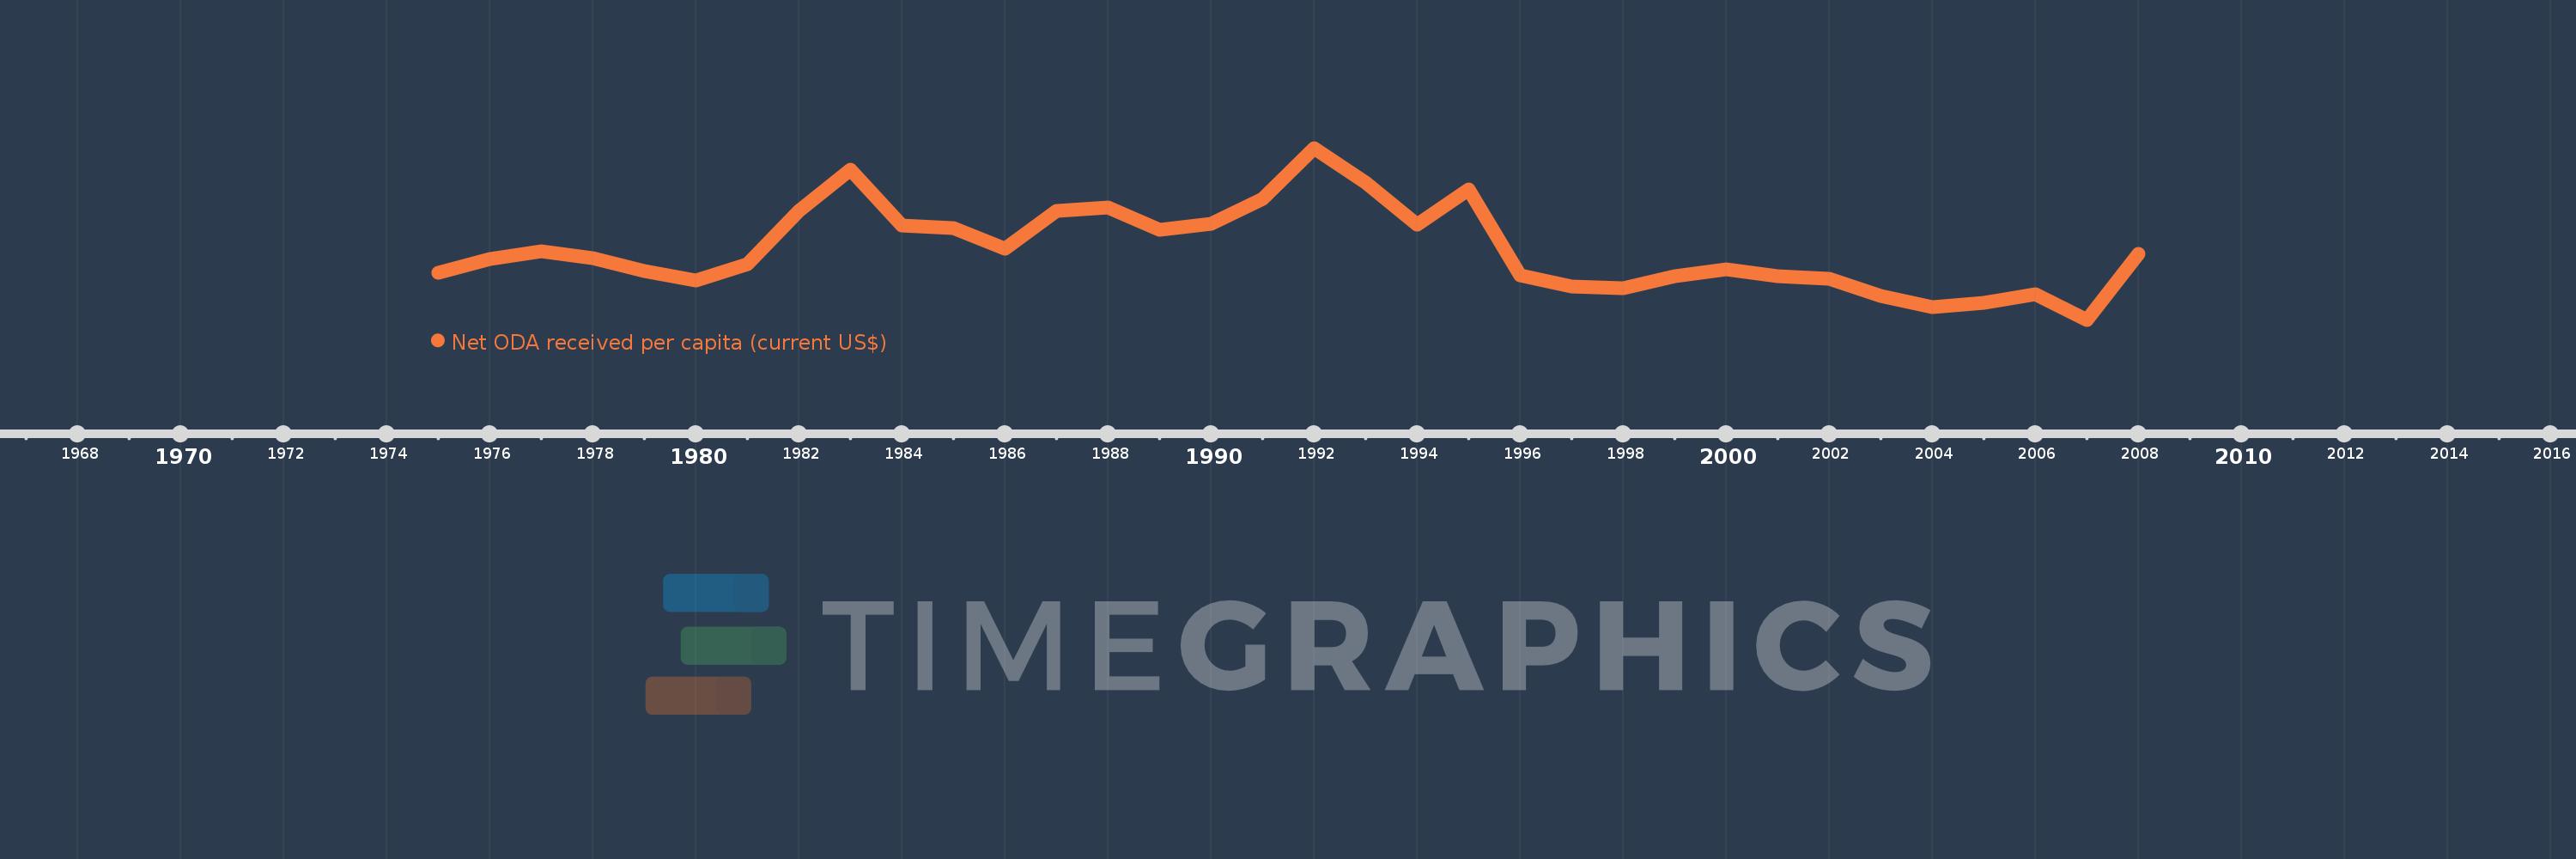
Net ODA received per capita (current US$)
2008,2007,2006,2005,2004,2003,2002,2001,2000,1999,1998,1997,1996,1995,1994,1993,1992,1991,1990,1989,1988,1987,1986,1985,1984,1983,1982,1981,1980,1979,1978,1977,1976,1975
This statistics in other country:
AfghanistanAlbaniaAlgeriaAngolaAntigua and BarbudaArab WorldArgentinaArmeniaArubaAzerbaijanBahamas, TheBahrainBangladeshBarbadosBelarusBelizeBeninBermudaBhutanBoliviaBosnia and HerzegovinaBotswanaBrazilBritish Virgin IslandsBrunei DarussalamBurkina FasoBurundiCabo VerdeCambodiaCameroonCaribbean small statesCayman IslandsCentral African RepublicCentral Europe and the BalticsChadChileChinaColombiaComorosCongo, Dem. Rep.Congo, Rep.Costa RicaCote d'IvoireCroatiaCubaCyprusDjiboutiDominicaDominican RepublicEast Asia & PacificEast Asia & Pacific (excluding high income)East Asia & Pacific (IDA & IBRD countries)EcuadorEgypt, Arab Rep.El SalvadorEquatorial GuineaEritreaEthiopiaEuro areaEurope & Central AsiaEurope & Central Asia (excluding high income)Europe & Central Asia (IDA & IBRD countries)European UnionFijiFragile and conflict affected situationsFrench PolynesiaGabonGambia, TheGeorgiaGhanaGibraltarGrenadaGuatemalaGuineaGuinea-BissauGuyanaHaitiHeavily indebted poor countries (HIPC)High incomeHondurasHong Kong SAR, ChinaIBRD onlyIDA & IBRD totalIDA blendIDA onlyIDA totalIndiaIndonesiaIran, Islamic Rep.IraqIsraelJamaicaJordanKazakhstanKenyaKiribatiKorea, Dem. People’s Rep.Korea, Rep.KosovoKuwaitKyrgyz RepublicLao PDRLatin America & Caribbean Latin America & Caribbean (excluding high income)Latin America & the Caribbean (IDA & IBRD countries)Least developed countries: UN classificationLebanonLesothoLiberiaLibyaLow & middle incomeLow incomeLower middle incomeMacao SAR, ChinaMacedonia, FYRMadagascarMalawiMalaysiaMaldivesMaliMaltaMarshall IslandsMauritaniaMauritiusMexicoMicronesia, Fed. Sts.Middle East & North AfricaMiddle East & North Africa (excluding high income)Middle East & North Africa (IDA & IBRD countries)Middle incomeMoldovaMongoliaMontenegroMoroccoMozambiqueMyanmarNamibiaNauruNepalNew CaledoniaNicaraguaNigerNigeriaNorth AmericaNorthern Mariana IslandsOECD membersOmanOther small statesPacific island small statesPakistanPalauPanamaPapua New GuineaParaguayPeruPhilippinesQatarRwandaSamoaSao Tome and PrincipeSaudi ArabiaSenegalSerbiaSeychellesSierra LeoneSingaporeSloveniaSmall statesSolomon IslandsSomaliaSouth AfricaSouth AsiaSouth Asia (IDA & IBRD)South SudanSri LankaSt. Kitts and NevisSt. LuciaSt. Vincent and the GrenadinesSub-Saharan Africa Sub-Saharan Africa (excluding high income)Sub-Saharan Africa (IDA & IBRD countries)SudanSurinameSwazilandSyrian Arab RepublicTajikistanTanzaniaThailandTimor-LesteTogoTongaTrinidad and TobagoTunisiaTurkeyTurkmenistanTurks and Caicos IslandsTuvaluUgandaUkraineUnited Arab EmiratesUpper middle incomeUruguayUzbekistanVanuatuVenezuela, RBVietnamWest Bank and GazaWorldYemen, Rep.ZambiaZimbabwe Timeline:
This timeline shows a graph from 1975 to 2008 of Turks and Caicos Islands. No data until 1974. Number of actual observations by date: 34.
Source name:
World Development Indicators
Source organization:
Development Assistance Committee of the Organisation for Economic Co-operation and Development, Geographical Distribution of Financial Flows to Developing Countries, Development Co-operation Report, and International Development Statistics database. Data are available online at: www.oecd.org/dac/stats/idsonline. World Bank population estimates are used for the denominator.
Categories, topics:
Aid Effectiveness, Economy & Growth, External Debt
Last updated:
apr 23, 2017
Indicators value changes by year
Minimum:
-15.194
jan 1, 2007
Maximum:
1.434K
jan 1, 1992
At the date of observation
Value
Absolute change
Change from previous value
jan 1, 1975
379.767
+379.767
0.0%
jan 1, 1976
496.486
+116.72
30.73%
jan 1, 1977
559.274
+62.788
12.65%
jan 1, 1978
501.017
-58.258
-10.42%
jan 1, 1979
393.935
-107.081
-21.37%
jan 1, 1980
319.471
-74.464
-18.9%
jan 1, 1981
450.498
+131.027
41.01%
jan 1, 1982
900.064
+449.565
99.79%
jan 1, 1983
1.252K
+351.604
39.06%
jan 1, 1984
777.304
-474.364
-37.9%
jan 1, 1985
755.194
-22.11
-2.84%
jan 1, 1986
584.088
-171.106
-22.66%
jan 1, 1987
900.436
+316.348
54.16%
jan 1, 1988
934.077
+33.641
3.74%
jan 1, 1989
745.183
-188.893
-20.22%
jan 1, 1990
796.806
+51.622
6.93%
jan 1, 1991
1.004K
+207.523
26.04%
jan 1, 1992
1.434K
+429.51
42.77%
jan 1, 1993
1.141K
-292.744
-20.42%
jan 1, 1994
790.256
-350.839
-30.75%
jan 1, 1995
1.082K
+291.473
36.88%
jan 1, 1996
361.941
-719.788
-66.54%
jan 1, 1997
261.79
-100.151
-27.67%
jan 1, 1998
254.13
-7.66
-2.93%
jan 1, 1999
351.759
+97.629
38.42%
jan 1, 2000
413.075
+61.316
17.43%
jan 1, 2001
352.299
-60.776
-14.71%
jan 1, 2002
330.427
-21.872
-6.21%
jan 1, 2003
188.592
-141.835
-42.92%
jan 1, 2004
93.969
-94.624
-50.17%
jan 1, 2005
125.874
+31.905
33.95%
jan 1, 2006
196.597
+70.723
56.19%
jan 1, 2007
-15.194
-211.792
-107.73%
jan 1, 2008
537.398
+552.592
-3.64K%
Ranking of countries by current statistics by years


Comments: