29
/
en
AIzaSyAYiBZKx7MnpbEhh9jyipgxe19OcubqV5w
April 1, 2024
100305
Cameroon
CMR
true
2
1
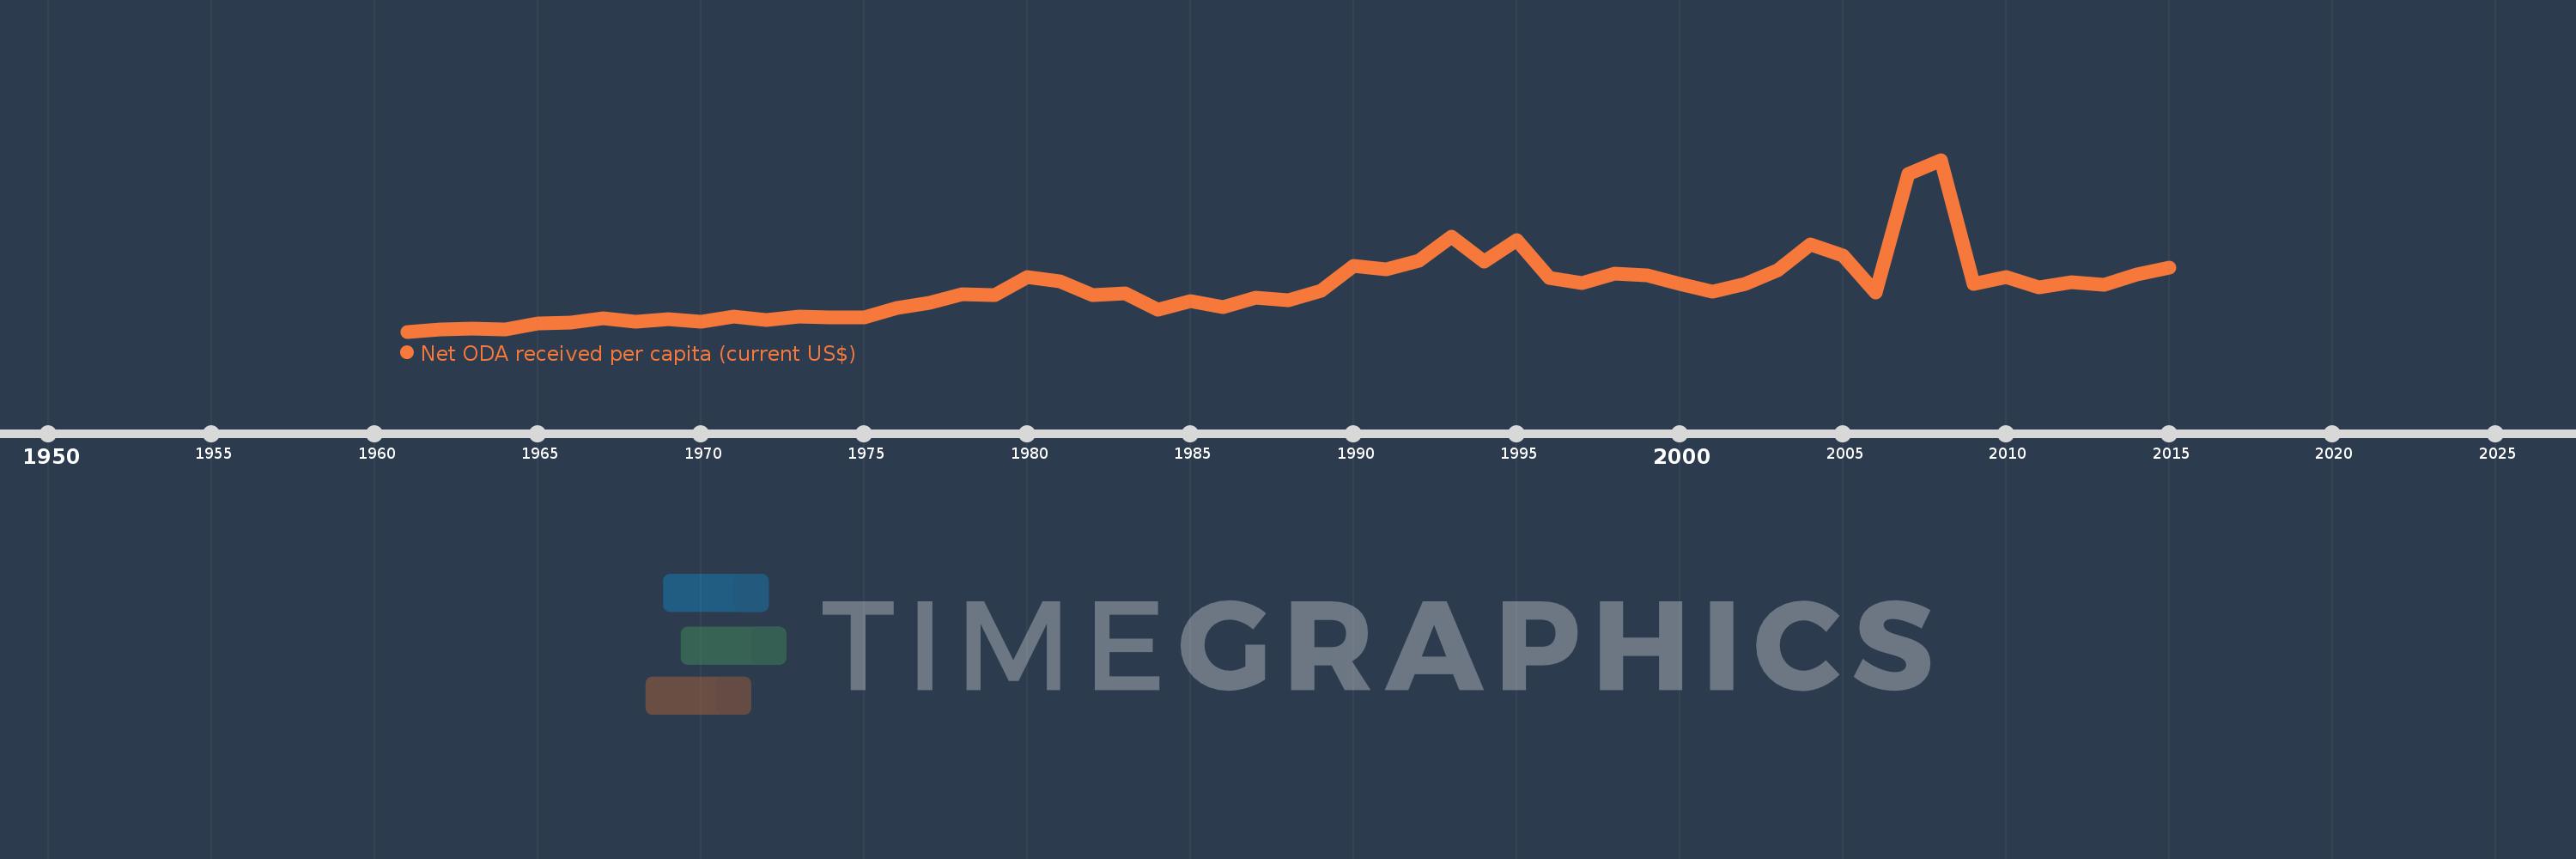
Net ODA received per capita (current US$)
2015,2014,2013,2012,2011,2010,2009,2008,2007,2006,2005,2004,2003,2002,2001,2000,1999,1998,1997,1996,1995,1994,1993,1992,1991,1990,1989,1988,1987,1986,1985,1984,1983,1982,1981,1980,1979,1978,1977,1976,1975,1974,1973,1972,1971,1970,1969,1968,1967,1966,1965,1964,1963,1962,1961
This statistics in other country:
AfghanistanAlbaniaAlgeriaAngolaAntigua and BarbudaArab WorldArgentinaArmeniaArubaAzerbaijanBahamas, TheBahrainBangladeshBarbadosBelarusBelizeBeninBermudaBhutanBoliviaBosnia and HerzegovinaBotswanaBrazilBritish Virgin IslandsBrunei DarussalamBurkina FasoBurundiCabo VerdeCambodiaCameroonCaribbean small statesCayman IslandsCentral African RepublicCentral Europe and the BalticsChadChileChinaColombiaComorosCongo, Dem. Rep.Congo, Rep.Costa RicaCote d'IvoireCroatiaCubaCyprusDjiboutiDominicaDominican RepublicEast Asia & PacificEast Asia & Pacific (excluding high income)East Asia & Pacific (IDA & IBRD countries)EcuadorEgypt, Arab Rep.El SalvadorEquatorial GuineaEritreaEthiopiaEuro areaEurope & Central AsiaEurope & Central Asia (excluding high income)Europe & Central Asia (IDA & IBRD countries)European UnionFijiFragile and conflict affected situationsFrench PolynesiaGabonGambia, TheGeorgiaGhanaGibraltarGrenadaGuatemalaGuineaGuinea-BissauGuyanaHaitiHeavily indebted poor countries (HIPC)High incomeHondurasHong Kong SAR, ChinaIBRD onlyIDA & IBRD totalIDA blendIDA onlyIDA totalIndiaIndonesiaIran, Islamic Rep.IraqIsraelJamaicaJordanKazakhstanKenyaKiribatiKorea, Dem. People’s Rep.Korea, Rep.KosovoKuwaitKyrgyz RepublicLao PDRLatin America & Caribbean Latin America & Caribbean (excluding high income)Latin America & the Caribbean (IDA & IBRD countries)Least developed countries: UN classificationLebanonLesothoLiberiaLibyaLow & middle incomeLow incomeLower middle incomeMacao SAR, ChinaMacedonia, FYRMadagascarMalawiMalaysiaMaldivesMaliMaltaMarshall IslandsMauritaniaMauritiusMexicoMicronesia, Fed. Sts.Middle East & North AfricaMiddle East & North Africa (excluding high income)Middle East & North Africa (IDA & IBRD countries)Middle incomeMoldovaMongoliaMontenegroMoroccoMozambiqueMyanmarNamibiaNauruNepalNew CaledoniaNicaraguaNigerNigeriaNorth AmericaNorthern Mariana IslandsOECD membersOmanOther small statesPacific island small statesPakistanPalauPanamaPapua New GuineaParaguayPeruPhilippinesQatarRwandaSamoaSao Tome and PrincipeSaudi ArabiaSenegalSerbiaSeychellesSierra LeoneSingaporeSloveniaSmall statesSolomon IslandsSomaliaSouth AfricaSouth AsiaSouth Asia (IDA & IBRD)South SudanSri LankaSt. Kitts and NevisSt. LuciaSt. Vincent and the GrenadinesSub-Saharan Africa Sub-Saharan Africa (excluding high income)Sub-Saharan Africa (IDA & IBRD countries)SudanSurinameSwazilandSyrian Arab RepublicTajikistanTanzaniaThailandTimor-LesteTogoTongaTrinidad and TobagoTunisiaTurkeyTurkmenistanTurks and Caicos IslandsTuvaluUgandaUkraineUnited Arab EmiratesUpper middle incomeUruguayUzbekistanVanuatuVenezuela, RBVietnamWest Bank and GazaWorldYemen, Rep.ZambiaZimbabwe Timeline:
This timeline shows a graph from 1961 to 2015 of Cameroon. No data until 1960. Number of actual observations by date: 55.
Source name:
World Development Indicators
Source organization:
Development Assistance Committee of the Organisation for Economic Co-operation and Development, Geographical Distribution of Financial Flows to Developing Countries, Development Co-operation Report, and International Development Statistics database. Data are available online at: www.oecd.org/dac/stats/idsonline. World Bank population estimates are used for the denominator.
Categories, topics:
Aid Effectiveness, Economy & Growth, External Debt
Last updated:
apr 23, 2017
Indicators value changes by year
Maximum:
100.969
jan 1, 2008
At the date of observation
Value
Absolute change
Change from previous value
jan 1, 1961
0.071
+0.071
0.0%
jan 1, 1962
1.301
+1.23
1.73K%
jan 1, 1963
1.689
+0.389
29.9%
jan 1, 1964
1.556
-0.133
-7.88%
jan 1, 1965
4.745
+3.189
204.91%
jan 1, 1966
5.391
+0.646
13.62%
jan 1, 1967
7.925
+2.534
47.01%
jan 1, 1968
6.028
-1.897
-23.94%
jan 1, 1969
7.435
+1.407
23.34%
jan 1, 1970
5.689
-1.746
-23.48%
jan 1, 1971
8.754
+3.065
53.87%
jan 1, 1972
6.935
-1.819
-20.78%
jan 1, 1973
8.811
+1.876
27.05%
jan 1, 1974
8.308
-0.503
-5.71%
jan 1, 1975
8.219
-0.089
-1.07%
jan 1, 1976
14.162
+5.943
72.3%
jan 1, 1977
16.968
+2.806
19.81%
jan 1, 1978
21.914
+4.946
29.15%
jan 1, 1979
21.318
-0.596
-2.72%
jan 1, 1980
31.915
+10.597
49.71%
jan 1, 1981
29.641
-2.274
-7.12%
jan 1, 1982
21.548
-8.093
-27.3%
jan 1, 1983
22.359
+0.811
3.76%
jan 1, 1984
13.066
-9.293
-41.56%
jan 1, 1985
18.17
+5.105
39.07%
jan 1, 1986
14.688
-3.482
-19.16%
jan 1, 1987
20.23
+5.542
37.73%
jan 1, 1988
18.413
-1.817
-8.98%
jan 1, 1989
24.241
+5.828
31.65%
jan 1, 1990
38.632
+14.391
59.37%
jan 1, 1991
36.816
-1.816
-4.7%
jan 1, 1992
41.532
+4.717
12.81%
jan 1, 1993
55.856
+14.324
34.49%
jan 1, 1994
41.288
-14.569
-26.08%
jan 1, 1995
53.893
+12.606
30.53%
jan 1, 1996
31.788
-22.105
-41.02%
jan 1, 1997
28.65
-3.138
-9.87%
jan 1, 1998
33.907
+5.257
18.35%
jan 1, 1999
32.916
-0.991
-2.92%
jan 1, 2000
27.993
-4.923
-14.96%
jan 1, 2001
23.652
-4.34
-15.51%
jan 1, 2002
27.999
+4.346
18.38%
jan 1, 2003
36.107
+8.108
28.96%
jan 1, 2004
51.455
+15.348
42.51%
jan 1, 2005
44.752
-6.703
-13.03%
jan 1, 2006
22.835
-21.917
-48.97%
jan 1, 2007
92.43
+69.595
304.77%
jan 1, 2008
100.969
+8.539
9.24%
jan 1, 2009
28.032
-72.937
-72.24%
jan 1, 2010
32.297
+4.265
15.22%
jan 1, 2011
26.27
-6.027
-18.66%
jan 1, 2012
28.949
+2.679
10.2%
jan 1, 2013
27.526
-1.423
-4.92%
jan 1, 2014
33.67
+6.144
22.32%
jan 1, 2015
37.425
+3.755
11.15%
Ranking of countries by current statistics by years


Comments: