29
/
en
AIzaSyAYiBZKx7MnpbEhh9jyipgxe19OcubqV5w
April 1, 2024
134989
French Polynesia
PYF
true
2
1
Net ODA received per capita (current US$)
2000,1999,1998,1997,1996,1995,1994,1993,1992,1991,1990,1989,1988,1987,1986,1985,1984,1983,1982,1981,1980,1979,1978,1977,1976,1975,1974,1973,1972,1971,1970,1969,1968,1967
This statistics in other country:
AfghanistanAlbaniaAlgeriaAngolaAntigua and BarbudaArab WorldArgentinaArmeniaArubaAzerbaijanBahamas, TheBahrainBangladeshBarbadosBelarusBelizeBeninBermudaBhutanBoliviaBosnia and HerzegovinaBotswanaBrazilBritish Virgin IslandsBrunei DarussalamBurkina FasoBurundiCabo VerdeCambodiaCameroonCaribbean small statesCayman IslandsCentral African RepublicCentral Europe and the BalticsChadChileChinaColombiaComorosCongo, Dem. Rep.Congo, Rep.Costa RicaCote d'IvoireCroatiaCubaCyprusDjiboutiDominicaDominican RepublicEast Asia & PacificEast Asia & Pacific (excluding high income)East Asia & Pacific (IDA & IBRD countries)EcuadorEgypt, Arab Rep.El SalvadorEquatorial GuineaEritreaEthiopiaEuro areaEurope & Central AsiaEurope & Central Asia (excluding high income)Europe & Central Asia (IDA & IBRD countries)European UnionFijiFragile and conflict affected situationsFrench PolynesiaGabonGambia, TheGeorgiaGhanaGibraltarGrenadaGuatemalaGuineaGuinea-BissauGuyanaHaitiHeavily indebted poor countries (HIPC)High incomeHondurasHong Kong SAR, ChinaIBRD onlyIDA & IBRD totalIDA blendIDA onlyIDA totalIndiaIndonesiaIran, Islamic Rep.IraqIsraelJamaicaJordanKazakhstanKenyaKiribatiKorea, Dem. People’s Rep.Korea, Rep.KosovoKuwaitKyrgyz RepublicLao PDRLatin America & Caribbean Latin America & Caribbean (excluding high income)Latin America & the Caribbean (IDA & IBRD countries)Least developed countries: UN classificationLebanonLesothoLiberiaLibyaLow & middle incomeLow incomeLower middle incomeMacao SAR, ChinaMacedonia, FYRMadagascarMalawiMalaysiaMaldivesMaliMaltaMarshall IslandsMauritaniaMauritiusMexicoMicronesia, Fed. Sts.Middle East & North AfricaMiddle East & North Africa (excluding high income)Middle East & North Africa (IDA & IBRD countries)Middle incomeMoldovaMongoliaMontenegroMoroccoMozambiqueMyanmarNamibiaNauruNepalNew CaledoniaNicaraguaNigerNigeriaNorth AmericaNorthern Mariana IslandsOECD membersOmanOther small statesPacific island small statesPakistanPalauPanamaPapua New GuineaParaguayPeruPhilippinesQatarRwandaSamoaSao Tome and PrincipeSaudi ArabiaSenegalSerbiaSeychellesSierra LeoneSingaporeSloveniaSmall statesSolomon IslandsSomaliaSouth AfricaSouth AsiaSouth Asia (IDA & IBRD)South SudanSri LankaSt. Kitts and NevisSt. LuciaSt. Vincent and the GrenadinesSub-Saharan Africa Sub-Saharan Africa (excluding high income)Sub-Saharan Africa (IDA & IBRD countries)SudanSurinameSwazilandSyrian Arab RepublicTajikistanTanzaniaThailandTimor-LesteTogoTongaTrinidad and TobagoTunisiaTurkeyTurkmenistanTurks and Caicos IslandsTuvaluUgandaUkraineUnited Arab EmiratesUpper middle incomeUruguayUzbekistanVanuatuVenezuela, RBVietnamWest Bank and GazaWorldYemen, Rep.ZambiaZimbabwe Timeline:
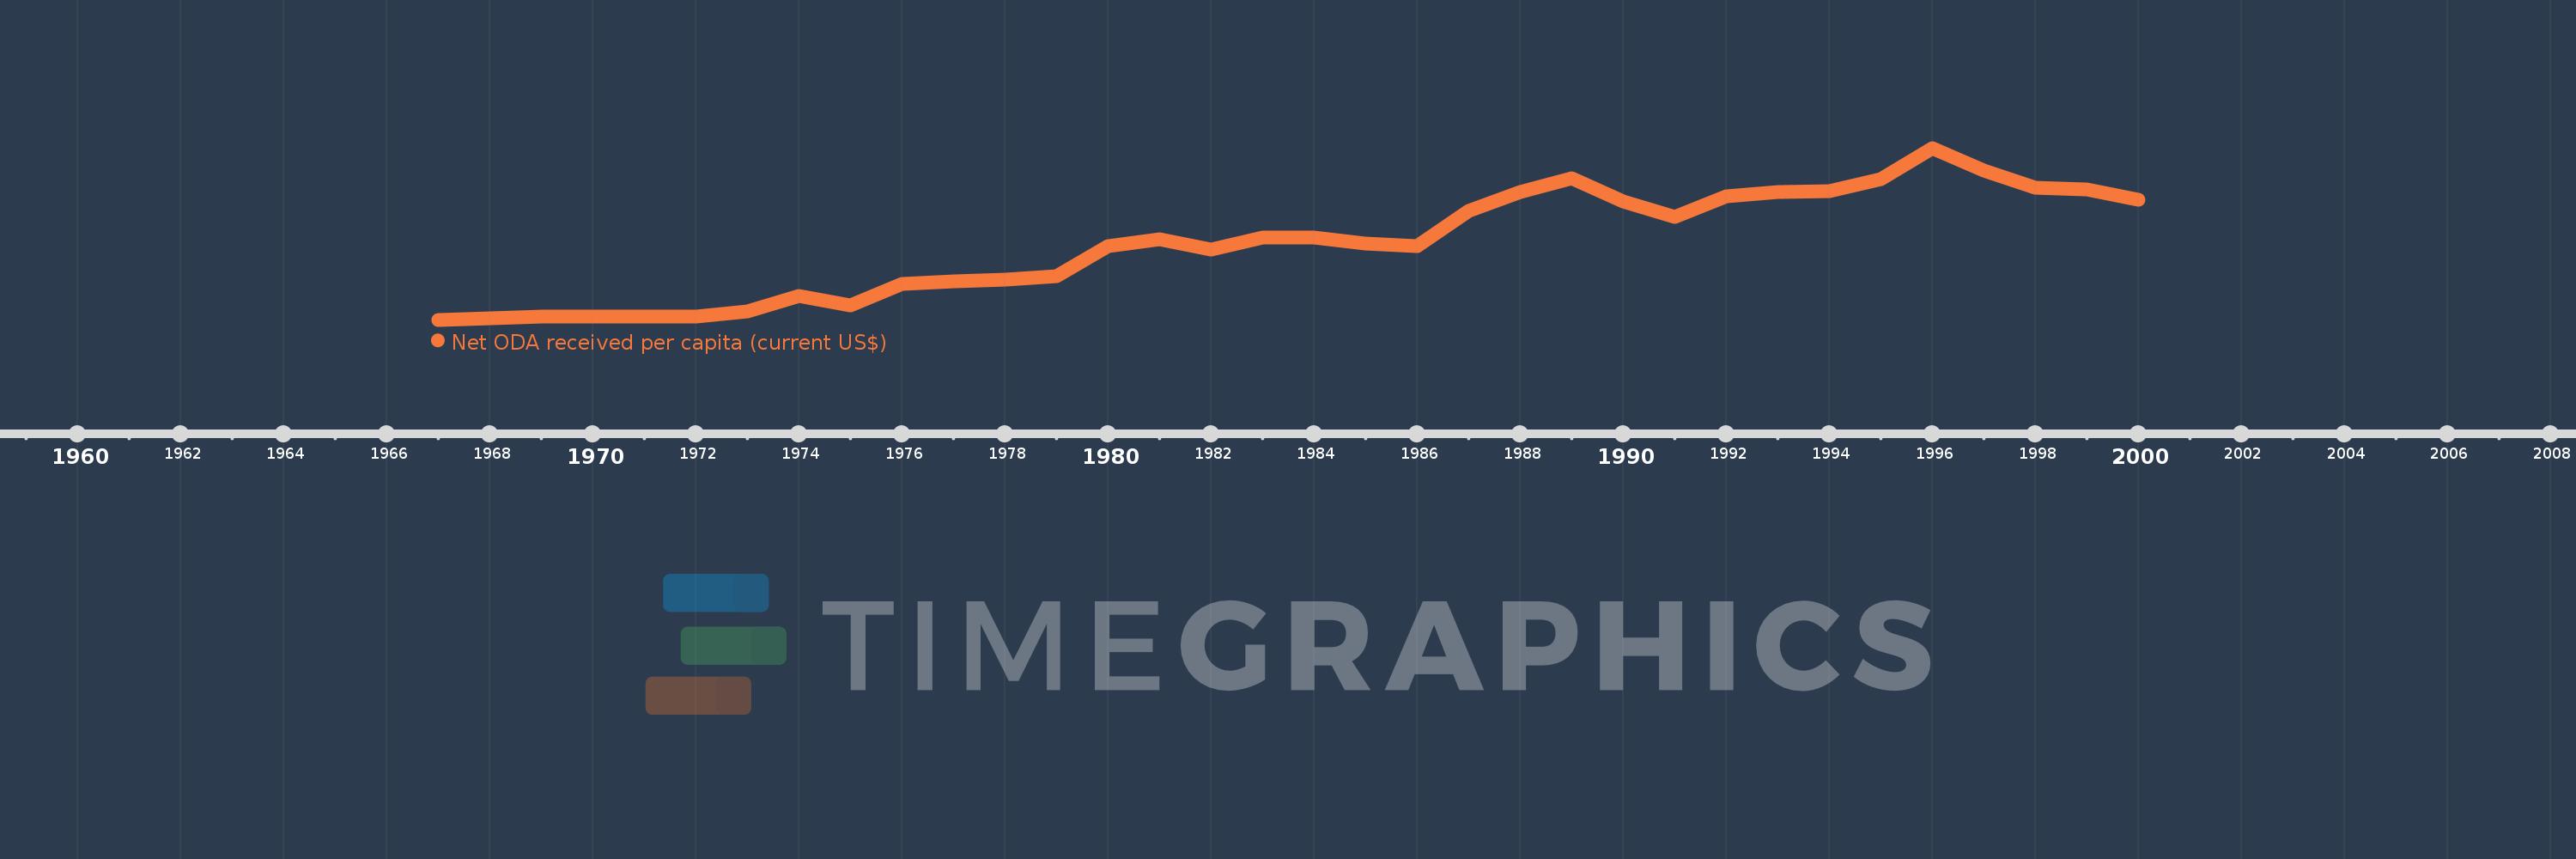
This timeline shows a graph from 1967 to 2000 of French Polynesia. No data until 1966. Number of actual observations by date: 34.
Source name:
World Development Indicators
Source organization:
Development Assistance Committee of the Organisation for Economic Co-operation and Development, Geographical Distribution of Financial Flows to Developing Countries, Development Co-operation Report, and International Development Statistics database. Data are available online at: www.oecd.org/dac/stats/idsonline. World Bank population estimates are used for the denominator.
Categories, topics:
Aid Effectiveness, Economy & Growth, External Debt
Last updated:
apr 23, 2017
Indicators value changes by year
Minimum:
138.943
jan 1, 1967
Maximum:
2.095K
jan 1, 1996
At the date of observation
Value
Absolute change
Change from previous value
jan 1, 1967
138.943
+138.943
0.0%
jan 1, 1968
151.353
+12.41
8.93%
jan 1, 1969
176.234
+24.881
16.44%
jan 1, 1970
173.033
-3.201
-1.82%
jan 1, 1971
178.921
+5.887
3.4%
jan 1, 1972
172.074
-6.846
-3.83%
jan 1, 1973
232.417
+60.342
35.07%
jan 1, 1974
411.507
+179.091
77.06%
jan 1, 1975
297.748
-113.76
-27.64%
jan 1, 1976
549.231
+251.483
84.46%
jan 1, 1977
576.282
+27.051
4.93%
jan 1, 1978
599.35
+23.068
4.0%
jan 1, 1979
633.77
+34.419
5.74%
jan 1, 1980
977.06
+343.29
54.17%
jan 1, 1981
1.051K
+74.079
7.58%
jan 1, 1982
938.812
-112.328
-10.69%
jan 1, 1983
1.077K
+137.871
14.69%
jan 1, 1984
1.074K
-3.083
-0.29%
jan 1, 1985
1.01K
-63.958
-5.96%
jan 1, 1986
981.633
-28.009
-2.77%
jan 1, 1987
1.375K
+393.395
40.08%
jan 1, 1988
1.592K
+217.117
15.79%
jan 1, 1989
1.745K
+153.277
9.63%
jan 1, 1990
1.486K
-259.598
-14.87%
jan 1, 1991
1.309K
-176.857
-11.9%
jan 1, 1992
1.542K
+232.81
17.79%
jan 1, 1993
1.592K
+50.23
3.26%
jan 1, 1994
1.601K
+8.623
0.54%
jan 1, 1995
1.739K
+138.205
8.63%
jan 1, 1996
2.095K
+356.563
20.51%
jan 1, 1997
1.843K
-252.704
-12.06%
jan 1, 1998
1.642K
-200.612
-10.89%
jan 1, 1999
1.622K
-20.357
-1.24%
jan 1, 2000
1.509K
-112.858
-6.96%
Ranking of countries by current statistics by years


Comments: