29
/
en
AIzaSyAYiBZKx7MnpbEhh9jyipgxe19OcubqV5w
April 1, 2024
238561
Seychelles
SYC
true
2
1
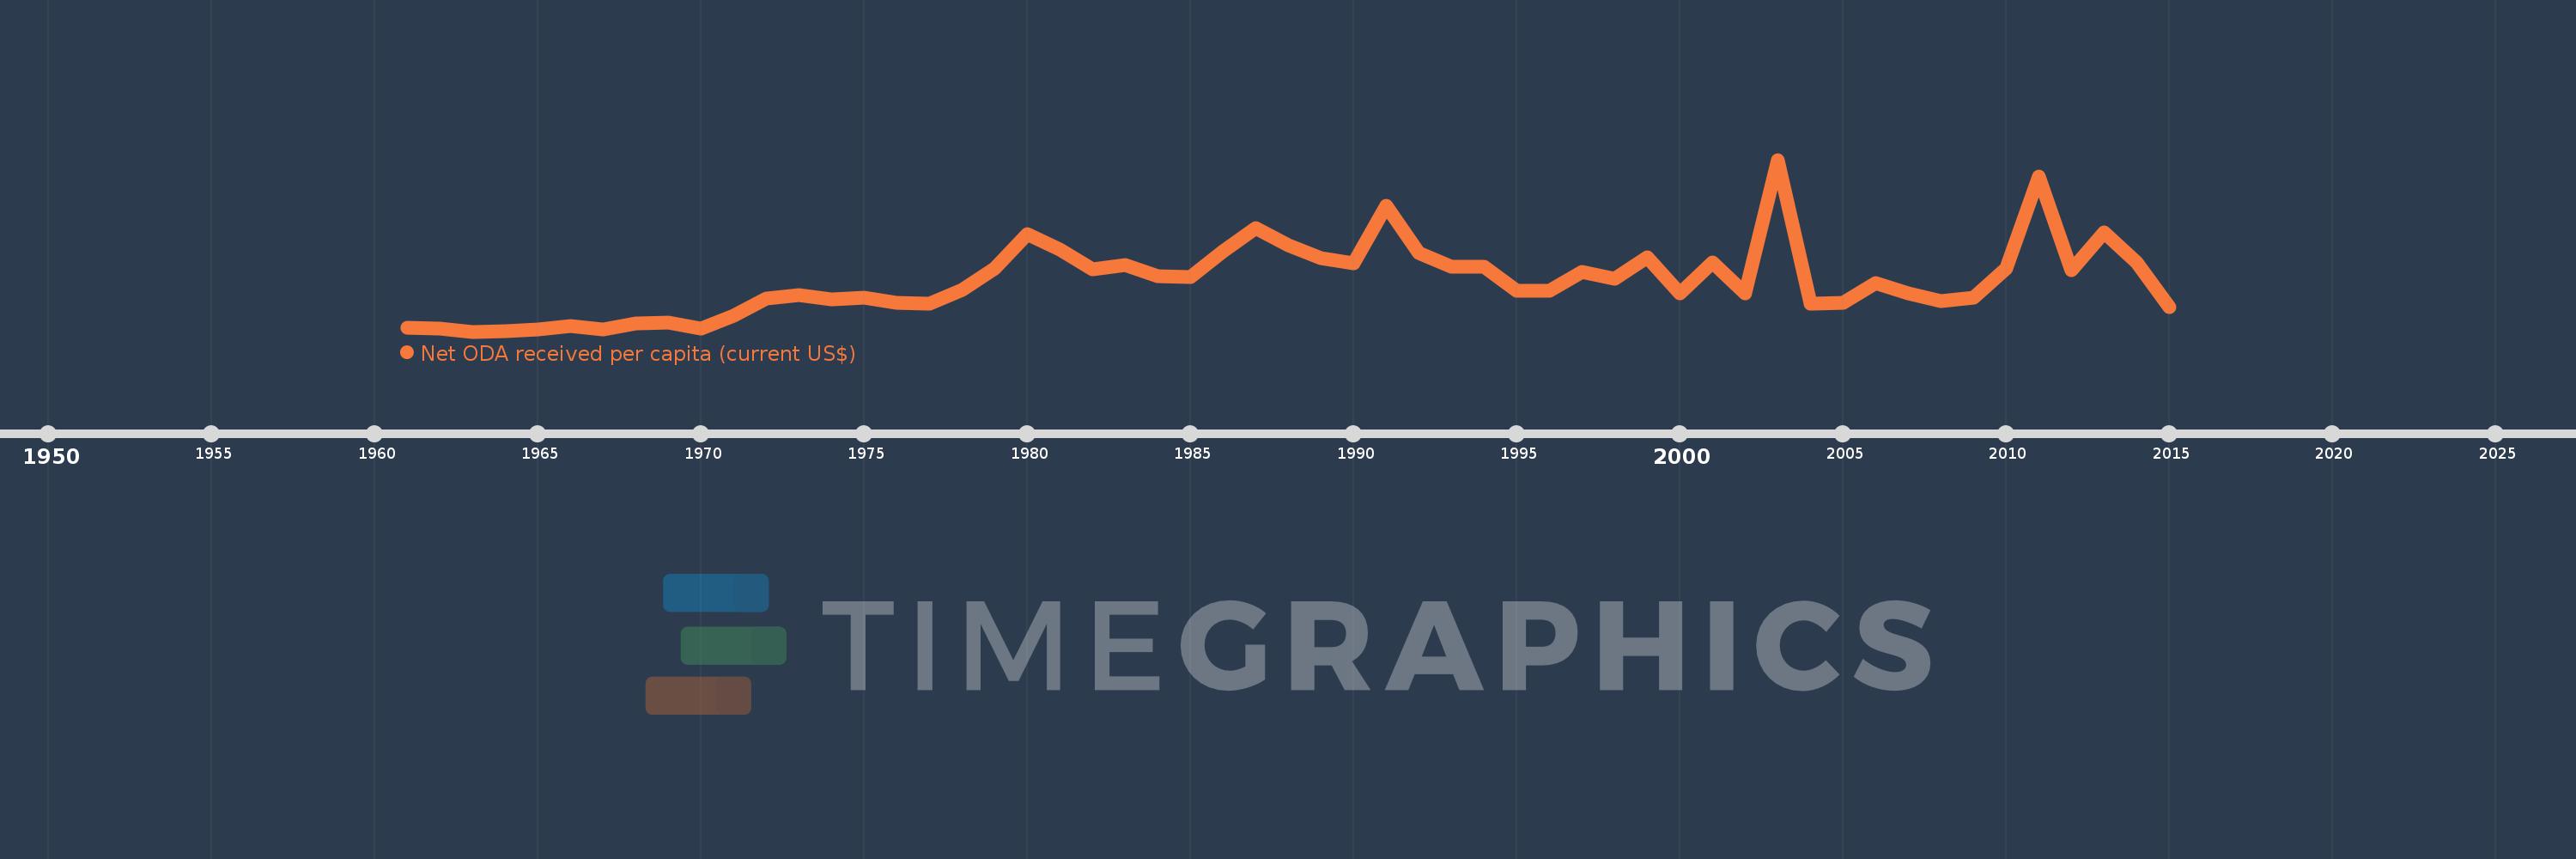
Net ODA received per capita (current US$)
2015,2014,2013,2012,2011,2010,2009,2008,2007,2006,2005,2004,2003,2002,2001,2000,1999,1998,1997,1996,1995,1994,1993,1992,1991,1990,1989,1988,1987,1986,1985,1984,1983,1982,1981,1980,1979,1978,1977,1976,1975,1974,1973,1972,1971,1970,1969,1968,1967,1966,1965,1964,1963,1962,1961
This statistics in other country:
AfghanistanAlbaniaAlgeriaAngolaAntigua and BarbudaArab WorldArgentinaArmeniaArubaAzerbaijanBahamas, TheBahrainBangladeshBarbadosBelarusBelizeBeninBermudaBhutanBoliviaBosnia and HerzegovinaBotswanaBrazilBritish Virgin IslandsBrunei DarussalamBurkina FasoBurundiCabo VerdeCambodiaCameroonCaribbean small statesCayman IslandsCentral African RepublicCentral Europe and the BalticsChadChileChinaColombiaComorosCongo, Dem. Rep.Congo, Rep.Costa RicaCote d'IvoireCroatiaCubaCyprusDjiboutiDominicaDominican RepublicEast Asia & PacificEast Asia & Pacific (excluding high income)East Asia & Pacific (IDA & IBRD countries)EcuadorEgypt, Arab Rep.El SalvadorEquatorial GuineaEritreaEthiopiaEuro areaEurope & Central AsiaEurope & Central Asia (excluding high income)Europe & Central Asia (IDA & IBRD countries)European UnionFijiFragile and conflict affected situationsFrench PolynesiaGabonGambia, TheGeorgiaGhanaGibraltarGrenadaGuatemalaGuineaGuinea-BissauGuyanaHaitiHeavily indebted poor countries (HIPC)High incomeHondurasHong Kong SAR, ChinaIBRD onlyIDA & IBRD totalIDA blendIDA onlyIDA totalIndiaIndonesiaIran, Islamic Rep.IraqIsraelJamaicaJordanKazakhstanKenyaKiribatiKorea, Dem. People’s Rep.Korea, Rep.KosovoKuwaitKyrgyz RepublicLao PDRLatin America & Caribbean Latin America & Caribbean (excluding high income)Latin America & the Caribbean (IDA & IBRD countries)Least developed countries: UN classificationLebanonLesothoLiberiaLibyaLow & middle incomeLow incomeLower middle incomeMacao SAR, ChinaMacedonia, FYRMadagascarMalawiMalaysiaMaldivesMaliMaltaMarshall IslandsMauritaniaMauritiusMexicoMicronesia, Fed. Sts.Middle East & North AfricaMiddle East & North Africa (excluding high income)Middle East & North Africa (IDA & IBRD countries)Middle incomeMoldovaMongoliaMontenegroMoroccoMozambiqueMyanmarNamibiaNauruNepalNew CaledoniaNicaraguaNigerNigeriaNorth AmericaNorthern Mariana IslandsOECD membersOmanOther small statesPacific island small statesPakistanPalauPanamaPapua New GuineaParaguayPeruPhilippinesQatarRwandaSamoaSao Tome and PrincipeSaudi ArabiaSenegalSerbiaSeychellesSierra LeoneSingaporeSloveniaSmall statesSolomon IslandsSomaliaSouth AfricaSouth AsiaSouth Asia (IDA & IBRD)South SudanSri LankaSt. Kitts and NevisSt. LuciaSt. Vincent and the GrenadinesSub-Saharan Africa Sub-Saharan Africa (excluding high income)Sub-Saharan Africa (IDA & IBRD countries)SudanSurinameSwazilandSyrian Arab RepublicTajikistanTanzaniaThailandTimor-LesteTogoTongaTrinidad and TobagoTunisiaTurkeyTurkmenistanTurks and Caicos IslandsTuvaluUgandaUkraineUnited Arab EmiratesUpper middle incomeUruguayUzbekistanVanuatuVenezuela, RBVietnamWest Bank and GazaWorldYemen, Rep.ZambiaZimbabwe Timeline:
This timeline shows a graph from 1961 to 2015 of Seychelles. No data until 1960. Number of actual observations by date: 55.
Source name:
World Development Indicators
Source organization:
Development Assistance Committee of the Organisation for Economic Co-operation and Development, Geographical Distribution of Financial Flows to Developing Countries, Development Co-operation Report, and International Development Statistics database. Data are available online at: www.oecd.org/dac/stats/idsonline. World Bank population estimates are used for the denominator.
Categories, topics:
Aid Effectiveness, Economy & Growth, External Debt
Last updated:
apr 23, 2017
Indicators value changes by year
Minimum:
11.126
jan 1, 1963
Maximum:
688.769
jan 1, 2003
At the date of observation
Value
Absolute change
Change from previous value
jan 1, 1961
26.379
+26.379
0.0%
jan 1, 1962
23.316
-3.063
-11.61%
jan 1, 1963
11.126
-12.19
-52.28%
jan 1, 1964
14.167
+3.041
27.33%
jan 1, 1965
20.293
+6.126
43.24%
jan 1, 1966
32.632
+12.339
60.8%
jan 1, 1967
19.097
-13.535
-41.48%
jan 1, 1968
44.88
+25.783
135.01%
jan 1, 1969
48.109
+3.229
7.19%
jan 1, 1970
24.635
-23.474
-48.79%
jan 1, 1971
75.0
+50.365
204.45%
jan 1, 1972
141.151
+66.151
88.2%
jan 1, 1973
155.525
+14.375
10.18%
jan 1, 1974
139.48
-16.045
-10.32%
jan 1, 1975
145.897
+6.416
4.6%
jan 1, 1976
125.503
-20.393
-13.98%
jan 1, 1977
121.903
-3.6
-2.87%
jan 1, 1978
176.379
+54.476
44.69%
jan 1, 1979
261.055
+84.676
48.01%
jan 1, 1980
395.163
+134.108
51.37%
jan 1, 1981
333.851
-61.312
-15.52%
jan 1, 1982
258.414
-75.437
-22.6%
jan 1, 1983
275.16
+16.745
6.48%
jan 1, 1984
230.988
-44.171
-16.05%
jan 1, 1985
224.657
-6.331
-2.74%
jan 1, 1986
327.003
+102.346
45.56%
jan 1, 1987
420.466
+93.463
28.58%
jan 1, 1988
353.318
-67.148
-15.97%
jan 1, 1989
299.355
-53.963
-15.27%
jan 1, 1990
281.893
-17.462
-5.83%
jan 1, 1991
508.0
+226.107
80.21%
jan 1, 1992
321.391
-186.609
-36.73%
jan 1, 1993
266.408
-54.983
-17.11%
jan 1, 1994
266.535
+0.127
0.05%
jan 1, 1995
171.931
-94.604
-35.49%
jan 1, 1996
170.376
-1.555
-0.9%
jan 1, 1997
247.327
+76.951
45.17%
jan 1, 1998
220.515
-26.812
-10.84%
jan 1, 1999
303.757
+83.242
37.75%
jan 1, 2000
160.677
-143.08
-47.1%
jan 1, 2001
284.725
+124.048
77.2%
jan 1, 2002
162.927
-121.798
-42.78%
jan 1, 2003
688.769
+525.842
322.75%
jan 1, 2004
122.585
-566.185
-82.2%
jan 1, 2005
125.576
+2.991
2.44%
jan 1, 2006
201.809
+76.234
60.71%
jan 1, 2007
161.229
-40.58
-20.11%
jan 1, 2008
129.832
-31.397
-19.47%
jan 1, 2009
143.981
+14.149
10.9%
jan 1, 2010
260.716
+116.735
81.08%
jan 1, 2011
624.262
+363.546
139.44%
jan 1, 2012
252.627
-371.635
-59.53%
jan 1, 2013
402.931
+150.303
59.5%
jan 1, 2014
283.092
-119.838
-29.74%
jan 1, 2015
106.127
-176.965
-62.51%
Ranking of countries by current statistics by years


Comments: