29
/
en
AIzaSyAYiBZKx7MnpbEhh9jyipgxe19OcubqV5w
April 1, 2024
278045
Uruguay
URY
true
2
1
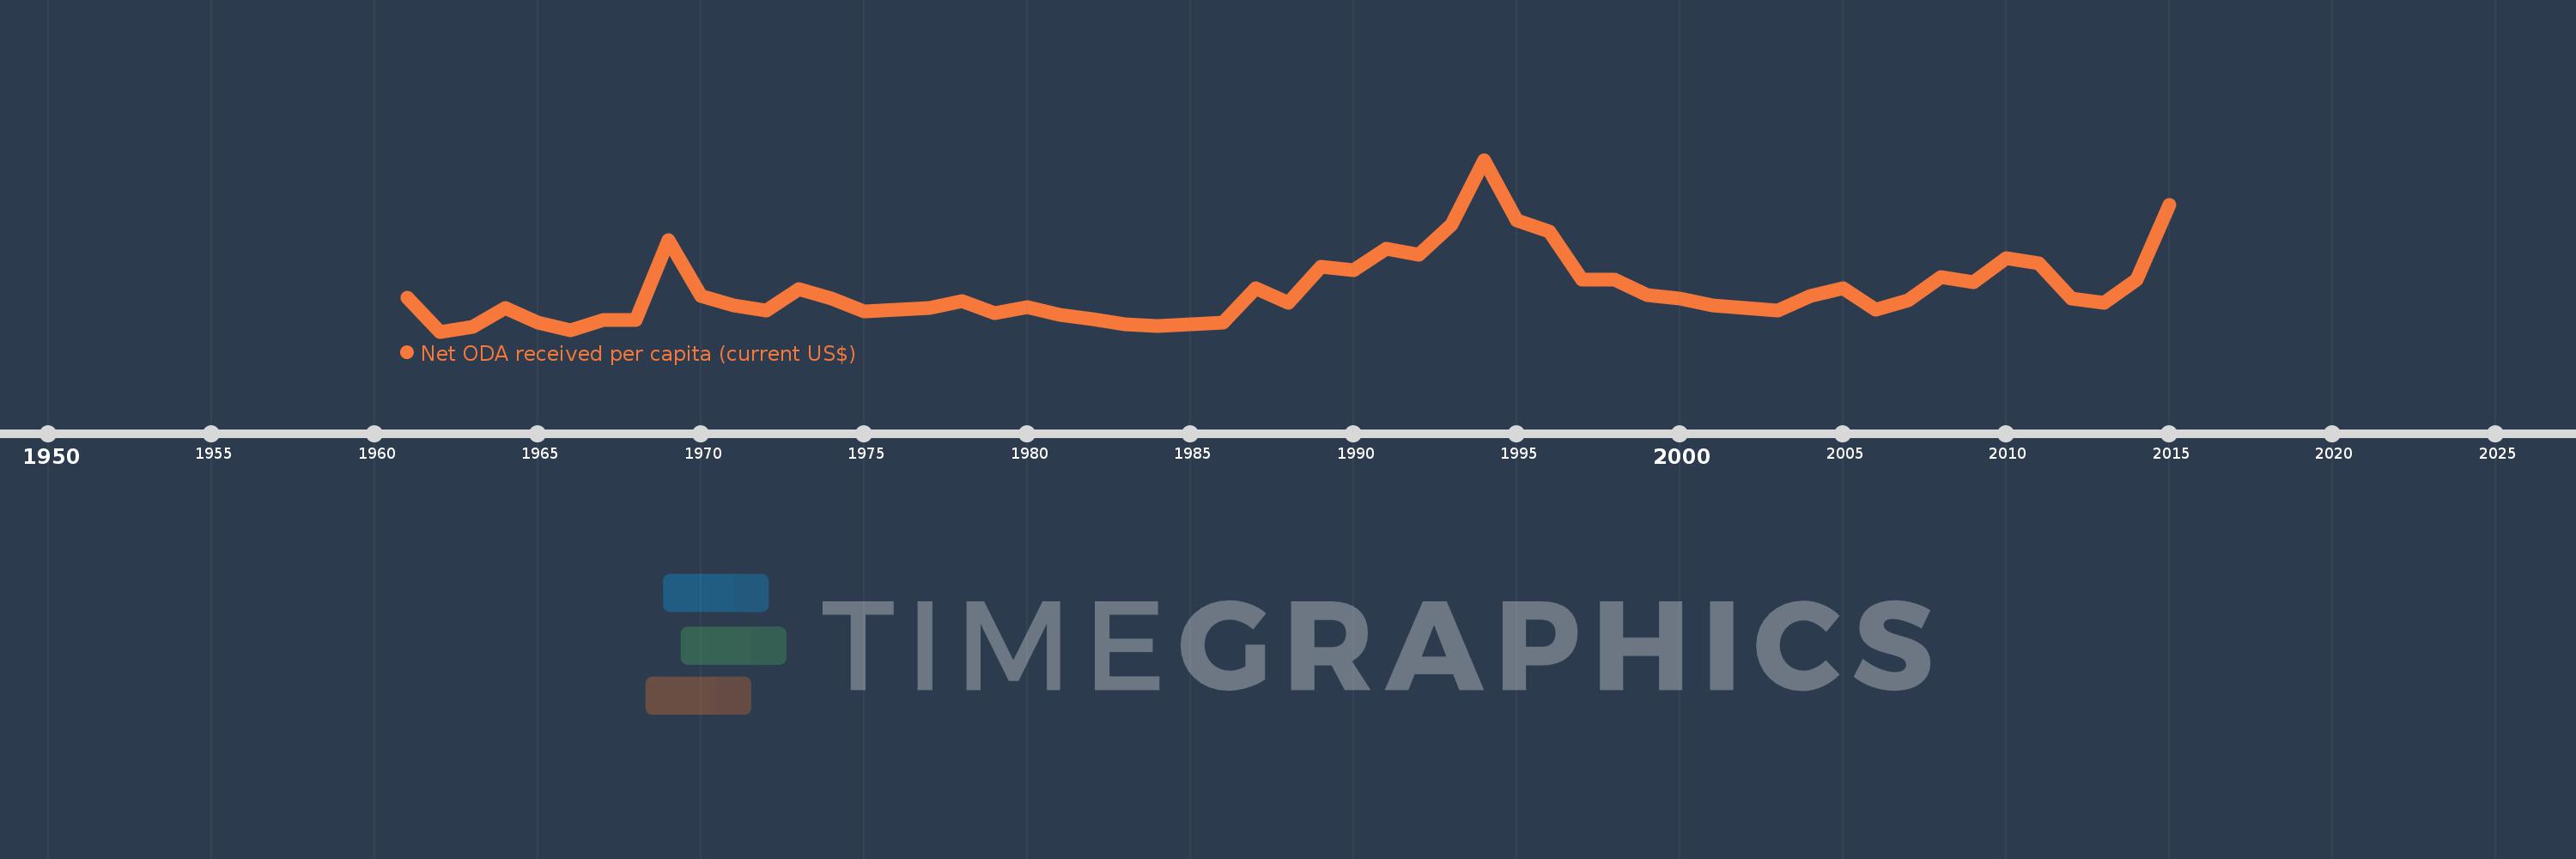
Net ODA received per capita (current US$)
2015,2014,2013,2012,2011,2010,2009,2008,2007,2006,2005,2004,2003,2002,2001,2000,1999,1998,1997,1996,1995,1994,1993,1992,1991,1990,1989,1988,1987,1986,1985,1984,1983,1982,1981,1980,1979,1978,1977,1976,1975,1974,1973,1972,1971,1970,1969,1968,1967,1966,1965,1964,1963,1962,1961
This statistics in other country:
AfghanistanAlbaniaAlgeriaAngolaAntigua and BarbudaArab WorldArgentinaArmeniaArubaAzerbaijanBahamas, TheBahrainBangladeshBarbadosBelarusBelizeBeninBermudaBhutanBoliviaBosnia and HerzegovinaBotswanaBrazilBritish Virgin IslandsBrunei DarussalamBurkina FasoBurundiCabo VerdeCambodiaCameroonCaribbean small statesCayman IslandsCentral African RepublicCentral Europe and the BalticsChadChileChinaColombiaComorosCongo, Dem. Rep.Congo, Rep.Costa RicaCote d'IvoireCroatiaCubaCyprusDjiboutiDominicaDominican RepublicEast Asia & PacificEast Asia & Pacific (excluding high income)East Asia & Pacific (IDA & IBRD countries)EcuadorEgypt, Arab Rep.El SalvadorEquatorial GuineaEritreaEthiopiaEuro areaEurope & Central AsiaEurope & Central Asia (excluding high income)Europe & Central Asia (IDA & IBRD countries)European UnionFijiFragile and conflict affected situationsFrench PolynesiaGabonGambia, TheGeorgiaGhanaGibraltarGrenadaGuatemalaGuineaGuinea-BissauGuyanaHaitiHeavily indebted poor countries (HIPC)High incomeHondurasHong Kong SAR, ChinaIBRD onlyIDA & IBRD totalIDA blendIDA onlyIDA totalIndiaIndonesiaIran, Islamic Rep.IraqIsraelJamaicaJordanKazakhstanKenyaKiribatiKorea, Dem. People’s Rep.Korea, Rep.KosovoKuwaitKyrgyz RepublicLao PDRLatin America & Caribbean Latin America & Caribbean (excluding high income)Latin America & the Caribbean (IDA & IBRD countries)Least developed countries: UN classificationLebanonLesothoLiberiaLibyaLow & middle incomeLow incomeLower middle incomeMacao SAR, ChinaMacedonia, FYRMadagascarMalawiMalaysiaMaldivesMaliMaltaMarshall IslandsMauritaniaMauritiusMexicoMicronesia, Fed. Sts.Middle East & North AfricaMiddle East & North Africa (excluding high income)Middle East & North Africa (IDA & IBRD countries)Middle incomeMoldovaMongoliaMontenegroMoroccoMozambiqueMyanmarNamibiaNauruNepalNew CaledoniaNicaraguaNigerNigeriaNorth AmericaNorthern Mariana IslandsOECD membersOmanOther small statesPacific island small statesPakistanPalauPanamaPapua New GuineaParaguayPeruPhilippinesQatarRwandaSamoaSao Tome and PrincipeSaudi ArabiaSenegalSerbiaSeychellesSierra LeoneSingaporeSloveniaSmall statesSolomon IslandsSomaliaSouth AfricaSouth AsiaSouth Asia (IDA & IBRD)South SudanSri LankaSt. Kitts and NevisSt. LuciaSt. Vincent and the GrenadinesSub-Saharan Africa Sub-Saharan Africa (excluding high income)Sub-Saharan Africa (IDA & IBRD countries)SudanSurinameSwazilandSyrian Arab RepublicTajikistanTanzaniaThailandTimor-LesteTogoTongaTrinidad and TobagoTunisiaTurkeyTurkmenistanTurks and Caicos IslandsTuvaluUgandaUkraineUnited Arab EmiratesUpper middle incomeUruguayUzbekistanVanuatuVenezuela, RBVietnamWest Bank and GazaWorldYemen, Rep.ZambiaZimbabwe Timeline:
This timeline shows a graph from 1961 to 2015 of Uruguay. No data until 1960. Number of actual observations by date: 55.
Source name:
World Development Indicators
Source organization:
Development Assistance Committee of the Organisation for Economic Co-operation and Development, Geographical Distribution of Financial Flows to Developing Countries, Development Co-operation Report, and International Development Statistics database. Data are available online at: www.oecd.org/dac/stats/idsonline. World Bank population estimates are used for the denominator.
Categories, topics:
Aid Effectiveness, Economy & Growth, External Debt
Last updated:
apr 23, 2017
Indicators value changes by year
Minimum:
-0.222
jan 1, 1962
Maximum:
35.222
jan 1, 1994
At the date of observation
Value
Absolute change
Change from previous value
jan 1, 1961
6.826
+6.826
0.0%
jan 1, 1962
-0.222
-7.048
-103.25%
jan 1, 1963
0.749
+0.971
-437.88%
jan 1, 1964
4.656
+3.907
521.77%
jan 1, 1965
1.658
-2.998
-64.39%
jan 1, 1966
0.119
-1.54
-92.84%
jan 1, 1967
2.185
+2.066
1.74K%
jan 1, 1968
2.214
+0.029
1.34%
jan 1, 1969
18.704
+16.49
744.64%
jan 1, 1970
7.163
-11.542
-61.71%
jan 1, 1971
5.21
-1.952
-27.26%
jan 1, 1972
4.127
-1.084
-20.8%
jan 1, 1973
8.52
+4.394
106.47%
jan 1, 1974
6.57
-1.951
-22.9%
jan 1, 1975
3.955
-2.614
-39.79%
jan 1, 1976
4.268
+0.313
7.91%
jan 1, 1977
4.621
+0.353
8.26%
jan 1, 1978
6.031
+1.41
30.51%
jan 1, 1979
3.547
-2.484
-41.19%
jan 1, 1980
4.82
+1.274
35.92%
jan 1, 1981
3.299
-1.521
-31.56%
jan 1, 1982
2.412
-0.887
-26.89%
jan 1, 1983
1.208
-1.204
-49.9%
jan 1, 1984
0.844
-0.364
-30.15%
jan 1, 1985
1.273
+0.429
50.82%
jan 1, 1986
1.59
+0.317
24.92%
jan 1, 1987
8.72
+7.129
448.29%
jan 1, 1988
5.764
-2.956
-33.9%
jan 1, 1989
13.238
+7.474
129.67%
jan 1, 1990
12.405
-0.833
-6.29%
jan 1, 1991
16.859
+4.453
35.9%
jan 1, 1992
15.587
-1.271
-7.54%
jan 1, 1993
21.801
+6.214
39.87%
jan 1, 1994
35.222
+13.42
61.56%
jan 1, 1995
22.726
-12.496
-35.48%
jan 1, 1996
20.361
-2.365
-10.41%
jan 1, 1997
10.548
-9.813
-48.2%
jan 1, 1998
10.459
-0.089
-0.85%
jan 1, 1999
7.333
-3.126
-29.89%
jan 1, 2000
6.639
-0.694
-9.46%
jan 1, 2001
5.239
-1.4
-21.09%
jan 1, 2002
4.566
-0.673
-12.85%
jan 1, 2003
4.123
-0.443
-9.7%
jan 1, 2004
7.09
+2.967
71.98%
jan 1, 2005
8.739
+1.649
23.25%
jan 1, 2006
4.342
-4.397
-50.32%
jan 1, 2007
6.325
+1.983
45.68%
jan 1, 2008
11.082
+4.756
75.19%
jan 1, 2009
9.935
-1.147
-10.35%
jan 1, 2010
14.878
+4.943
49.75%
jan 1, 2011
13.836
-1.041
-7.0%
jan 1, 2012
6.61
-7.226
-52.23%
jan 1, 2013
5.688
-0.923
-13.96%
jan 1, 2014
10.558
+4.87
85.62%
jan 1, 2015
25.942
+15.385
145.72%
Ranking of countries by current statistics by years


Comments: