29
/
en
AIzaSyAYiBZKx7MnpbEhh9jyipgxe19OcubqV5w
April 1, 2024
158754
Iraq
IRQ
true
2
1
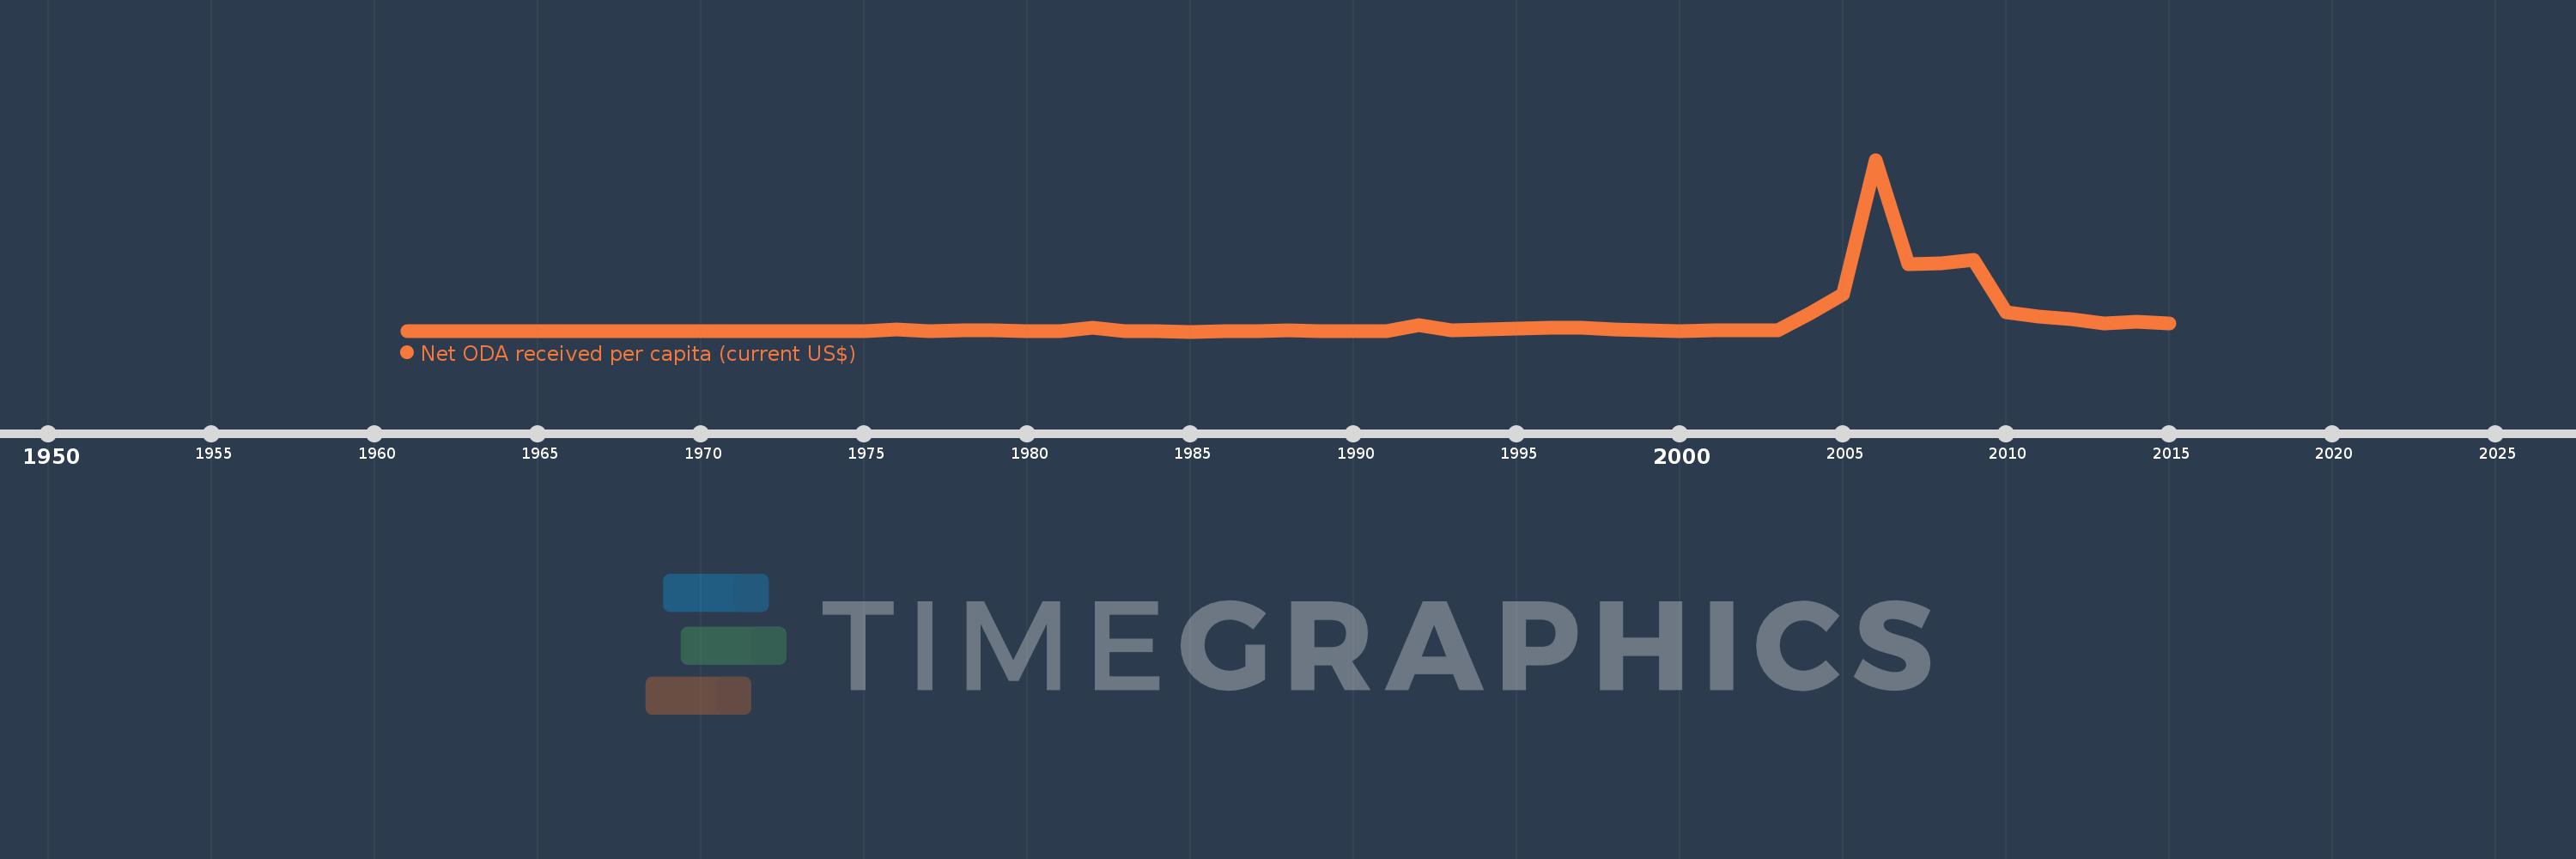
Net ODA received per capita (current US$)
2015,2014,2013,2012,2011,2010,2009,2008,2007,2006,2005,2004,2003,2002,2001,2000,1999,1998,1997,1996,1995,1994,1993,1992,1991,1990,1989,1988,1987,1986,1985,1984,1983,1982,1981,1980,1979,1978,1977,1976,1975,1974,1973,1972,1971,1970,1969,1968,1967,1966,1965,1964,1963,1962,1961
This statistics in other country:
AfghanistanAlbaniaAlgeriaAngolaAntigua and BarbudaArab WorldArgentinaArmeniaArubaAzerbaijanBahamas, TheBahrainBangladeshBarbadosBelarusBelizeBeninBermudaBhutanBoliviaBosnia and HerzegovinaBotswanaBrazilBritish Virgin IslandsBrunei DarussalamBurkina FasoBurundiCabo VerdeCambodiaCameroonCaribbean small statesCayman IslandsCentral African RepublicCentral Europe and the BalticsChadChileChinaColombiaComorosCongo, Dem. Rep.Congo, Rep.Costa RicaCote d'IvoireCroatiaCubaCyprusDjiboutiDominicaDominican RepublicEast Asia & PacificEast Asia & Pacific (excluding high income)East Asia & Pacific (IDA & IBRD countries)EcuadorEgypt, Arab Rep.El SalvadorEquatorial GuineaEritreaEthiopiaEuro areaEurope & Central AsiaEurope & Central Asia (excluding high income)Europe & Central Asia (IDA & IBRD countries)European UnionFijiFragile and conflict affected situationsFrench PolynesiaGabonGambia, TheGeorgiaGhanaGibraltarGrenadaGuatemalaGuineaGuinea-BissauGuyanaHaitiHeavily indebted poor countries (HIPC)High incomeHondurasHong Kong SAR, ChinaIBRD onlyIDA & IBRD totalIDA blendIDA onlyIDA totalIndiaIndonesiaIran, Islamic Rep.IraqIsraelJamaicaJordanKazakhstanKenyaKiribatiKorea, Dem. People’s Rep.Korea, Rep.KosovoKuwaitKyrgyz RepublicLao PDRLatin America & Caribbean Latin America & Caribbean (excluding high income)Latin America & the Caribbean (IDA & IBRD countries)Least developed countries: UN classificationLebanonLesothoLiberiaLibyaLow & middle incomeLow incomeLower middle incomeMacao SAR, ChinaMacedonia, FYRMadagascarMalawiMalaysiaMaldivesMaliMaltaMarshall IslandsMauritaniaMauritiusMexicoMicronesia, Fed. Sts.Middle East & North AfricaMiddle East & North Africa (excluding high income)Middle East & North Africa (IDA & IBRD countries)Middle incomeMoldovaMongoliaMontenegroMoroccoMozambiqueMyanmarNamibiaNauruNepalNew CaledoniaNicaraguaNigerNigeriaNorth AmericaNorthern Mariana IslandsOECD membersOmanOther small statesPacific island small statesPakistanPalauPanamaPapua New GuineaParaguayPeruPhilippinesQatarRwandaSamoaSao Tome and PrincipeSaudi ArabiaSenegalSerbiaSeychellesSierra LeoneSingaporeSloveniaSmall statesSolomon IslandsSomaliaSouth AfricaSouth AsiaSouth Asia (IDA & IBRD)South SudanSri LankaSt. Kitts and NevisSt. LuciaSt. Vincent and the GrenadinesSub-Saharan Africa Sub-Saharan Africa (excluding high income)Sub-Saharan Africa (IDA & IBRD countries)SudanSurinameSwazilandSyrian Arab RepublicTajikistanTanzaniaThailandTimor-LesteTogoTongaTrinidad and TobagoTunisiaTurkeyTurkmenistanTurks and Caicos IslandsTuvaluUgandaUkraineUnited Arab EmiratesUpper middle incomeUruguayUzbekistanVanuatuVenezuela, RBVietnamWest Bank and GazaWorldYemen, Rep.ZambiaZimbabwe Timeline:
This timeline shows a graph from 1961 to 2015 of Iraq. No data until 1960. Number of actual observations by date: 55.
Source name:
World Development Indicators
Source organization:
Development Assistance Committee of the Organisation for Economic Co-operation and Development, Geographical Distribution of Financial Flows to Developing Countries, Development Co-operation Report, and International Development Statistics database. Data are available online at: www.oecd.org/dac/stats/idsonline. World Bank population estimates are used for the denominator.
Categories, topics:
Aid Effectiveness, Economy & Growth, External Debt
Last updated:
apr 23, 2017
Indicators value changes by year
Maximum:
816.394
jan 1, 2006
At the date of observation
Value
Absolute change
Change from previous value
jan 1, 1961
0.199
+0.199
0.0%
jan 1, 1962
0.091
-0.108
-54.27%
jan 1, 1963
0.284
+0.193
212.28%
jan 1, 1964
0.654
+0.37
130.26%
jan 1, 1965
1.586
+0.932
142.44%
jan 1, 1966
1.28
-0.306
-19.29%
jan 1, 1967
0.473
-0.807
-63.06%
jan 1, 1968
0.456
-0.017
-3.55%
jan 1, 1969
0.247
-0.209
-45.77%
jan 1, 1970
0.448
+0.2
80.99%
jan 1, 1971
0.813
+0.365
81.58%
jan 1, 1972
1.595
+0.783
96.29%
jan 1, 1973
2.142
+0.547
34.31%
jan 1, 1974
1.214
-0.928
-43.31%
jan 1, 1975
0.374
-0.841
-69.21%
jan 1, 1976
9.442
+9.068
2.43K%
jan 1, 1977
1.682
-7.76
-82.19%
jan 1, 1978
6.558
+4.876
289.87%
jan 1, 1979
5.748
-0.81
-12.35%
jan 1, 1980
2.18
-3.569
-62.08%
jan 1, 1981
0.91
-1.269
-58.24%
jan 1, 1982
18.707
+17.797
1.95K%
jan 1, 1983
0.251
-18.457
-98.66%
jan 1, 1984
0.463
+0.213
84.82%
jan 1, 1985
-0.13
-0.594
-128.1%
jan 1, 1986
1.278
+1.408
-1.08K%
jan 1, 1987
1.774
+0.497
38.89%
jan 1, 1988
5.3
+3.526
198.71%
jan 1, 1989
0.39
-4.91
-92.64%
jan 1, 1990
0.638
+0.247
63.4%
jan 1, 1991
3.61
+2.972
466.12%
jan 1, 1992
30.774
+27.164
752.56%
jan 1, 1993
7.478
-23.296
-75.7%
jan 1, 1994
8.869
+1.391
18.6%
jan 1, 1995
12.929
+4.06
45.78%
jan 1, 1996
16.459
+3.53
27.3%
jan 1, 1997
16.77
+0.31
1.89%
jan 1, 1998
10.313
-6.457
-38.5%
jan 1, 1999
5.304
-5.009
-48.57%
jan 1, 2000
3.355
-1.949
-36.75%
jan 1, 2001
4.319
+0.965
28.75%
jan 1, 2002
5.058
+0.739
17.1%
jan 1, 2003
4.545
-0.513
-10.13%
jan 1, 2004
89.255
+84.71
1.86K%
jan 1, 2005
176.693
+87.438
97.96%
jan 1, 2006
816.394
+639.701
362.04%
jan 1, 2007
320.717
-495.676
-60.72%
jan 1, 2008
323.828
+3.111
0.97%
jan 1, 2009
338.937
+15.109
4.67%
jan 1, 2010
93.128
-245.809
-72.52%
jan 1, 2011
70.569
-22.559
-24.22%
jan 1, 2012
60.082
-10.486
-14.86%
jan 1, 2013
39.466
-20.616
-34.31%
jan 1, 2014
45.174
+5.707
14.46%
jan 1, 2015
38.835
-6.339
-14.03%
Ranking of countries by current statistics by years


Comments: