29
/
en
AIzaSyAYiBZKx7MnpbEhh9jyipgxe19OcubqV5w
April 1, 2024
137103
Gambia, The
GMB
true
2
1
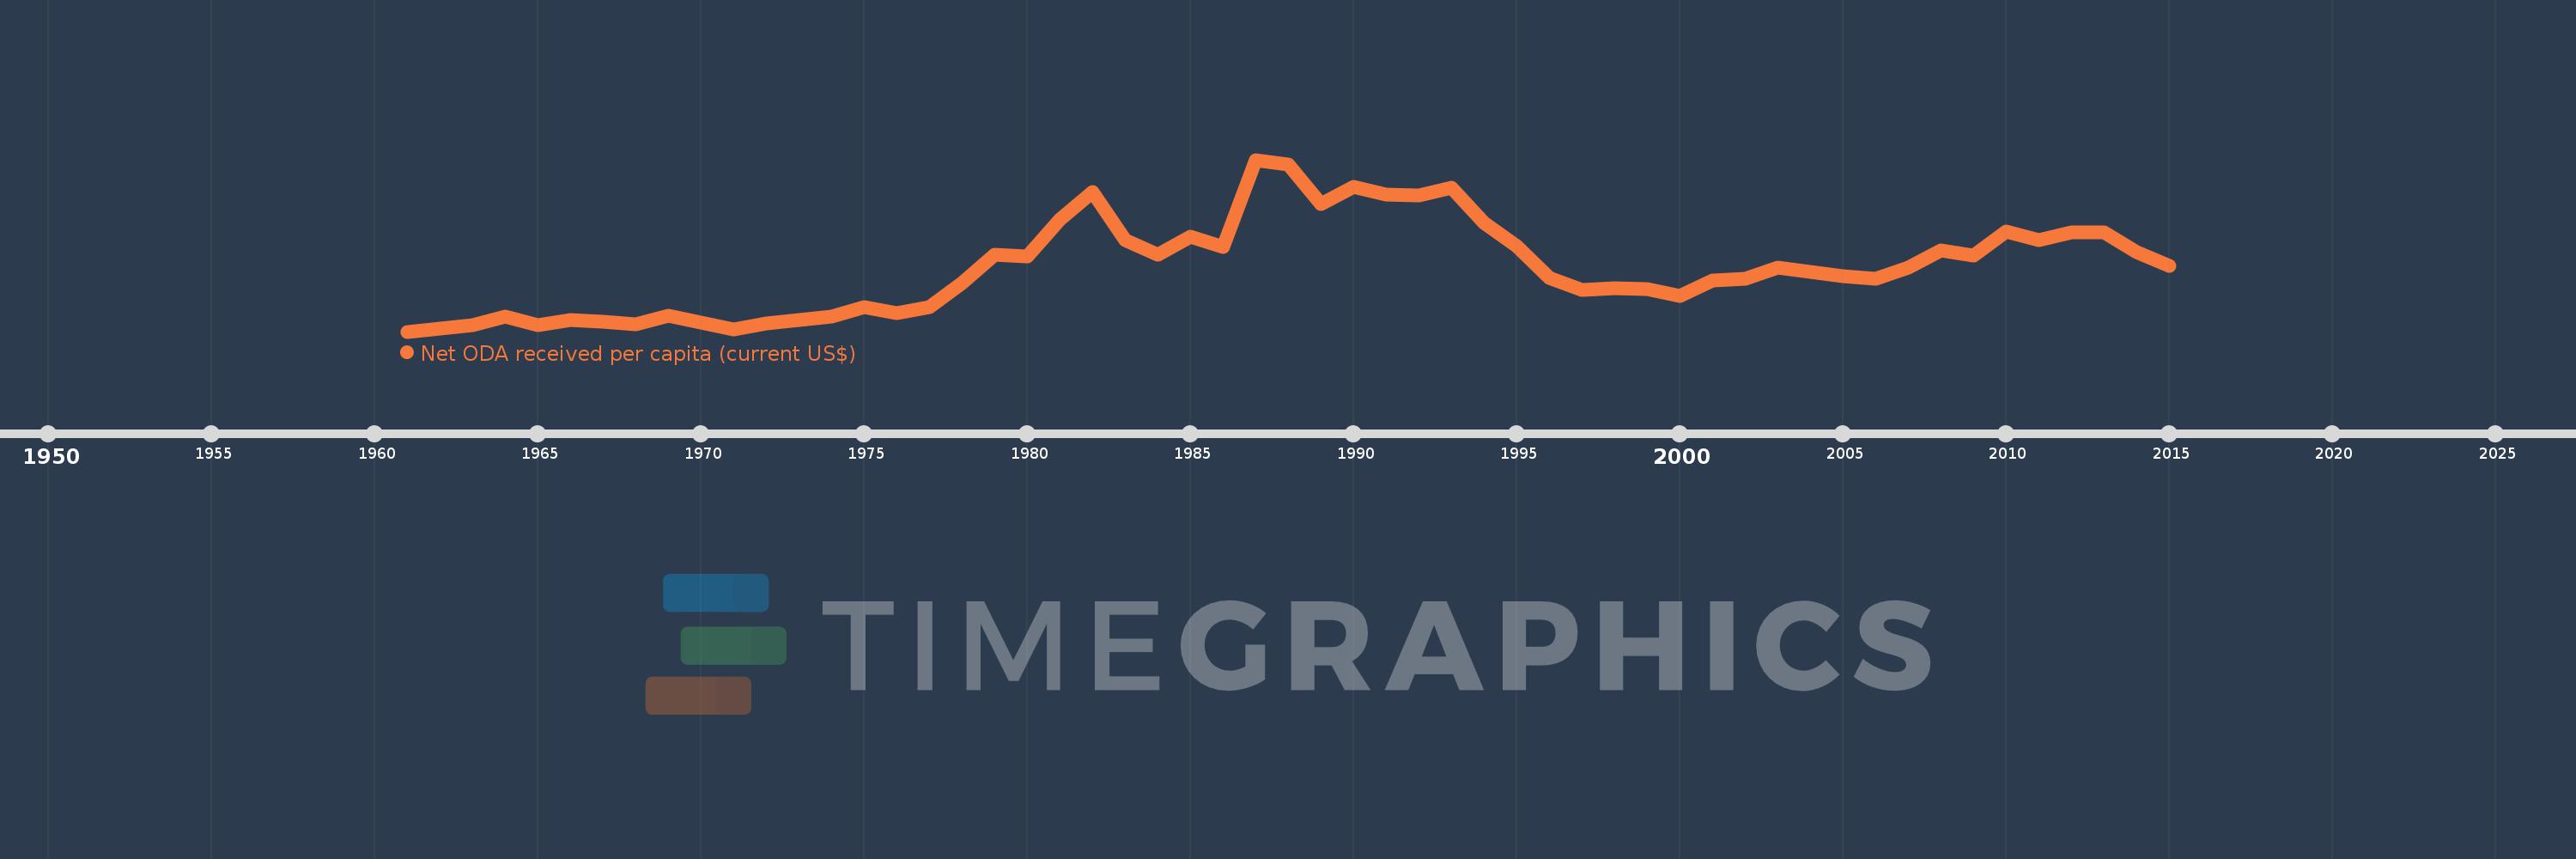
Net ODA received per capita (current US$)
2015,2014,2013,2012,2011,2010,2009,2008,2007,2006,2005,2004,2003,2002,2001,2000,1999,1998,1997,1996,1995,1994,1993,1992,1991,1990,1989,1988,1987,1986,1985,1984,1983,1982,1981,1980,1979,1978,1977,1976,1975,1974,1973,1972,1971,1970,1969,1968,1967,1966,1965,1964,1963,1962,1961
This statistics in other country:
AfghanistanAlbaniaAlgeriaAngolaAntigua and BarbudaArab WorldArgentinaArmeniaArubaAzerbaijanBahamas, TheBahrainBangladeshBarbadosBelarusBelizeBeninBermudaBhutanBoliviaBosnia and HerzegovinaBotswanaBrazilBritish Virgin IslandsBrunei DarussalamBurkina FasoBurundiCabo VerdeCambodiaCameroonCaribbean small statesCayman IslandsCentral African RepublicCentral Europe and the BalticsChadChileChinaColombiaComorosCongo, Dem. Rep.Congo, Rep.Costa RicaCote d'IvoireCroatiaCubaCyprusDjiboutiDominicaDominican RepublicEast Asia & PacificEast Asia & Pacific (excluding high income)East Asia & Pacific (IDA & IBRD countries)EcuadorEgypt, Arab Rep.El SalvadorEquatorial GuineaEritreaEthiopiaEuro areaEurope & Central AsiaEurope & Central Asia (excluding high income)Europe & Central Asia (IDA & IBRD countries)European UnionFijiFragile and conflict affected situationsFrench PolynesiaGabonGambia, TheGeorgiaGhanaGibraltarGrenadaGuatemalaGuineaGuinea-BissauGuyanaHaitiHeavily indebted poor countries (HIPC)High incomeHondurasHong Kong SAR, ChinaIBRD onlyIDA & IBRD totalIDA blendIDA onlyIDA totalIndiaIndonesiaIran, Islamic Rep.IraqIsraelJamaicaJordanKazakhstanKenyaKiribatiKorea, Dem. People’s Rep.Korea, Rep.KosovoKuwaitKyrgyz RepublicLao PDRLatin America & Caribbean Latin America & Caribbean (excluding high income)Latin America & the Caribbean (IDA & IBRD countries)Least developed countries: UN classificationLebanonLesothoLiberiaLibyaLow & middle incomeLow incomeLower middle incomeMacao SAR, ChinaMacedonia, FYRMadagascarMalawiMalaysiaMaldivesMaliMaltaMarshall IslandsMauritaniaMauritiusMexicoMicronesia, Fed. Sts.Middle East & North AfricaMiddle East & North Africa (excluding high income)Middle East & North Africa (IDA & IBRD countries)Middle incomeMoldovaMongoliaMontenegroMoroccoMozambiqueMyanmarNamibiaNauruNepalNew CaledoniaNicaraguaNigerNigeriaNorth AmericaNorthern Mariana IslandsOECD membersOmanOther small statesPacific island small statesPakistanPalauPanamaPapua New GuineaParaguayPeruPhilippinesQatarRwandaSamoaSao Tome and PrincipeSaudi ArabiaSenegalSerbiaSeychellesSierra LeoneSingaporeSloveniaSmall statesSolomon IslandsSomaliaSouth AfricaSouth AsiaSouth Asia (IDA & IBRD)South SudanSri LankaSt. Kitts and NevisSt. LuciaSt. Vincent and the GrenadinesSub-Saharan Africa Sub-Saharan Africa (excluding high income)Sub-Saharan Africa (IDA & IBRD countries)SudanSurinameSwazilandSyrian Arab RepublicTajikistanTanzaniaThailandTimor-LesteTogoTongaTrinidad and TobagoTunisiaTurkeyTurkmenistanTurks and Caicos IslandsTuvaluUgandaUkraineUnited Arab EmiratesUpper middle incomeUruguayUzbekistanVanuatuVenezuela, RBVietnamWest Bank and GazaWorldYemen, Rep.ZambiaZimbabwe Timeline:
This timeline shows a graph from 1961 to 2015 of Gambia, The. No data until 1960. Number of actual observations by date: 55.
Source name:
World Development Indicators
Source organization:
Development Assistance Committee of the Organisation for Economic Co-operation and Development, Geographical Distribution of Financial Flows to Developing Countries, Development Co-operation Report, and International Development Statistics database. Data are available online at: www.oecd.org/dac/stats/idsonline. World Bank population estimates are used for the denominator.
Categories, topics:
Aid Effectiveness, Economy & Growth, External Debt
Last updated:
apr 23, 2017
Indicators value changes by year
Maximum:
132.273
jan 1, 1987
At the date of observation
Value
Absolute change
Change from previous value
jan 1, 1961
1.468
+1.468
0.0%
jan 1, 1962
3.796
+2.328
158.62%
jan 1, 1963
6.649
+2.853
75.17%
jan 1, 1964
13.16
+6.511
97.92%
jan 1, 1965
6.463
-6.697
-50.89%
jan 1, 1966
10.602
+4.139
64.04%
jan 1, 1967
8.795
-1.807
-17.04%
jan 1, 1968
7.23
-1.565
-17.8%
jan 1, 1969
13.725
+6.495
89.84%
jan 1, 1970
8.421
-5.303
-38.64%
jan 1, 1971
2.929
-5.492
-65.22%
jan 1, 1972
7.671
+4.742
161.91%
jan 1, 1973
10.284
+2.613
34.06%
jan 1, 1974
13.147
+2.863
27.84%
jan 1, 1975
20.158
+7.011
53.33%
jan 1, 1976
15.43
-4.728
-23.45%
jan 1, 1977
20.227
+4.797
31.09%
jan 1, 1978
38.509
+18.282
90.38%
jan 1, 1979
60.194
+21.686
56.31%
jan 1, 1980
58.634
-1.56
-2.59%
jan 1, 1981
87.099
+28.465
48.55%
jan 1, 1982
107.737
+20.638
23.69%
jan 1, 1983
71.135
-36.602
-33.97%
jan 1, 1984
59.98
-11.156
-15.68%
jan 1, 1985
73.813
+13.833
23.06%
jan 1, 1986
65.62
-8.193
-11.1%
jan 1, 1987
132.273
+66.653
101.57%
jan 1, 1988
128.449
-3.824
-2.89%
jan 1, 1989
98.712
-29.737
-23.15%
jan 1, 1990
111.968
+13.256
13.43%
jan 1, 1991
106.085
-5.883
-5.25%
jan 1, 1992
104.835
-1.25
-1.18%
jan 1, 1993
111.095
+6.26
5.97%
jan 1, 1994
84.201
-26.894
-24.21%
jan 1, 1995
66.456
-17.746
-21.08%
jan 1, 1996
42.627
-23.829
-35.86%
jan 1, 1997
32.906
-9.721
-22.8%
jan 1, 1998
34.408
+1.501
4.56%
jan 1, 1999
33.926
-0.482
-1.4%
jan 1, 2000
28.686
-5.24
-15.45%
jan 1, 2001
40.395
+11.709
40.82%
jan 1, 2002
41.717
+1.322
3.27%
jan 1, 2003
50.127
+8.41
20.16%
jan 1, 2004
46.618
-3.509
-7.0%
jan 1, 2005
43.629
-2.989
-6.41%
jan 1, 2006
41.963
-1.665
-3.82%
jan 1, 2007
50.372
+8.409
20.04%
jan 1, 2008
63.264
+12.892
25.59%
jan 1, 2009
59.209
-4.055
-6.41%
jan 1, 2010
77.784
+18.575
31.37%
jan 1, 2011
70.862
-6.922
-8.9%
jan 1, 2012
76.92
+6.057
8.55%
jan 1, 2013
76.775
-0.145
-0.19%
jan 1, 2014
61.739
-15.035
-19.58%
jan 1, 2015
51.696
-10.044
-16.27%
Ranking of countries by current statistics by years


Comments: